04 - Loader analysis (Stage 2)
Stage 2 information
In the previous article, we retrieved Stage2 (a PE) encrypted and embedded in Stage1.
A first phase of research can be interesting in order to retrieve some pieces of information. If you're working on a new sample, it's likely to be missing from IOC and sample sharing platforms such as VirusTotal, MalwareBazaar... At this point, you'll need to use sandboxes, as described in the Reminders and preparation of the analysis environment chapter.
Information on Stage 2 is given below:
| Type | Data |
|---|---|
| SHA256 | 9874c7bd9d008c8a7105c8e402813204d5c3ddc3fb8d1aaddbb0e19d65062dfb |
| SHA1 | 8cfd1de05578d750b296d13f6f8bc1d78d42a891 |
| MD5 | 999af7adf5fa30b3d748da1b2e84affd |
| File size | 427.50 KB (437760 bytes) |
| First seen | 2024-04-16 14:48:13 UTC (VirusTotal) |
| Magic | PE32 executable (GUI) Intel 80386, for MS Windows |
| imphash | cdfd758783fcb7e7c9a9010b0d1ea06a |
| ssdeep | 6144:XI+yLuPAYp/YKaUdAOmNGZxYSwkrVEi597BoVAw5:zyL2AYp/Hl8NMYSwkrVEiZoVR5 |
Detonation in a sandbox
We will detonate the sample in a sandbox disconnected from the network to avoid leaving traces on the Internet and alerting the malicious actor. If you're on an incident response mission, or need to work on a sample requiring a high level of discretion, it's best not to submit the sample online.
To do this, you can install an open-source sandbox such as Cape Sandbox. You can follow the documentation to set up the sandbox on a server supporting virtualization. If you can't afford to host a Cape-type solution, you can detonate the sample in your Windows virtual machine. We recommend setting up a system such as Inetsim to simulate a network environment and detect potential requests made by the sample.
Once the sandbox is set up on your side, you can detonate the sample (Stage 2) to gather more information about it.
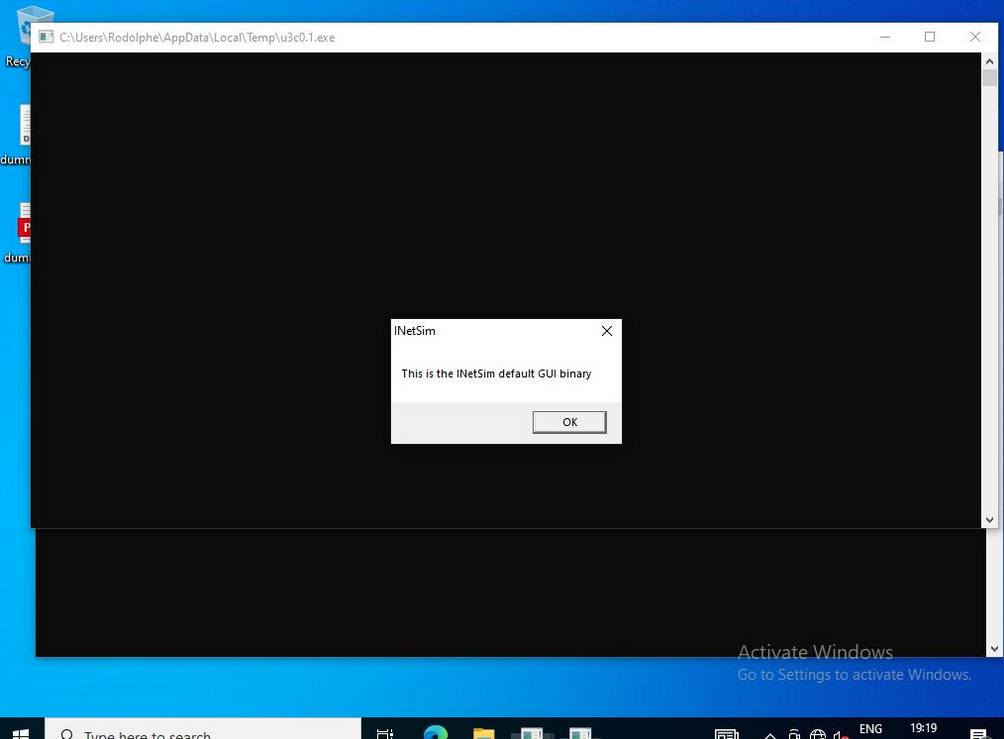
When we run the sample in the sandbox, we can see that the dummy sample of Inetsim is executed. This lets us know that an executable has been downloaded from the network and run:
If you look at the logs of your Inetsim service, you should find more or less the same elements that Cape Sandbox can show you:
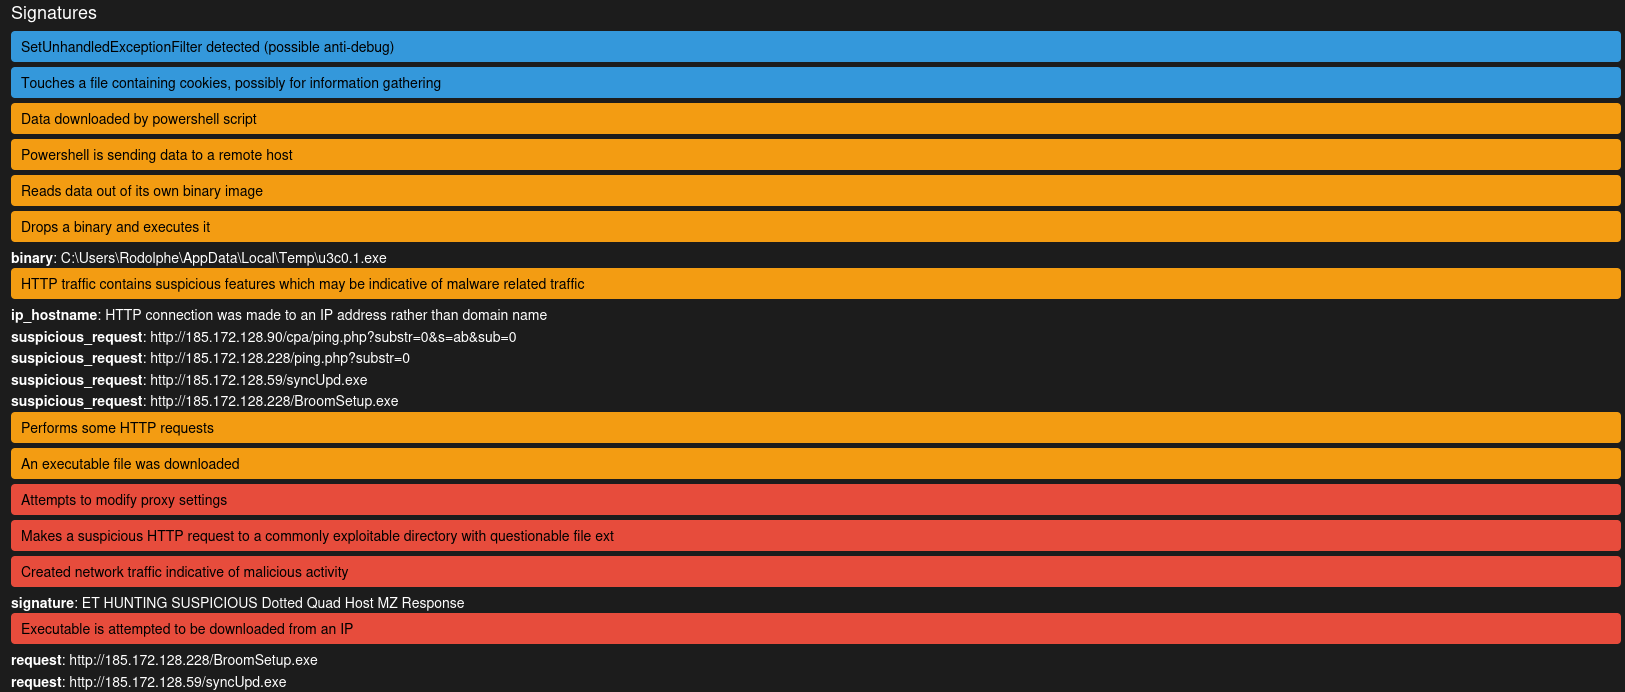
Thanks to this detonation, we are able to understand that the sample is a loader and executes stage 3. We can draw up the following IOC list:
| Type | IOC |
|---|---|
| ipv4 | 185.172.128[.]90 |
| ipv4 | 185.172.128[.]228 |
| ipv4 | 185.172.128[.]59 |
| ipv4 | 185.172.128[.]228 |
| filename | BroomSetup.exe |
| filename | syncUpd.exe |
| url | hxxp://185[.]172.128.90/cpa/ping.php?substr=0&s=ab&sub=0 |
| url | hxxp://185[.]172.128.228/ping.php?substr=0 |
| url | hxxp://185[.]172.128.59/syncUpd.exe |
| url | hxxp://185[.]172.128.228/BroomSetup.exe |
Sample recovery
To prevent the malicious infrastructure from shutting down its services, if your level of discretion allows it, you can download the supposedly malicious samples (syncUpd.exe and BroomSetup.exe). To do this, we recommend not using your exit IP directly, so as not to communicate with the malicious infrastructure. You can, for example, use the Tor network or a VPN provider, or even your own server hosted remotely and dedicated to this type of use.
Some malicious actors may block specific IP addresses, such as Tor exit nodes, User-Agent and so on. If you are faced with this type of problem, don't hesitate to reproduce a victim's execution environment as closely as possible. The location of an IP address can have an effect on C2's decision to respond to you. If the actor is targeting France, it's best to use a French IP.
From your sandbox, you can retrieve the User-Agent used by Stage 2 to carry out its request.

In our case, the malicious actor doesn't seem to be filtering. We can use curl via Tor to download the sample (the URLs have been deliberately filtered by us to avoid misuse by a reader):
torify curl -A "Mozilla/5.0 (Windows NT 10.0; Win64; x64) AppleWebKit/537.36 (KHTML, like Gecko) Chrome/122.0.6261.129 Safari/537.36" -O BroomSetup.exe.bin hxxp://185[.]172.128.228/BroomSetup.exe
torify curl -A "Mozilla/5.0 (Windows NT 10.0; Win64; x64) AppleWebKit/537.36 (KHTML, like Gecko) Chrome/122.0.6261.129 Safari/537.36" -O syncUpd.exe.bin hxxp://185[.]172.128.59/syncUpd.exe
When you search for the cryptographic fingerprint of the two samples on VirusTotal, you'll find that BroomSetup.exe is a legitimate program, while syncUpd.exe is identified as malicious. If you run a Yara scan with the rule we wrote in the Stage 1 chapter, you'll find that syncUpd.exe is packed with the same packer as Stage 1! We'll look at how to unpack it in the next chapter.
It's highly likely that by the time you take this article, the executables will no longer be accessible from the malicious actor's C2. We can send them to you on request.
If the sandbox method is all you need to retrieve C2 from the malicious actor, you can proceed to the next chapter. In the next section, we'll use MIASM to retrieve HTTP requests directly.
Retrieving loader requests with MIASM
Our Stage 2 (loader) appears to make HTTP requests to an IP address to transmit information, retrieve and then execute possibly malicious samples.
A sandbox can in some cases work if no antiVM system is in place in the sample. A sandbox may take some time to run and produce a report. If you need to scale up IOC extraction, you can automate the extraction process. As seen in the previous article on Stage 1, we'll look at how to retrieve these URLs with the MIASM framework.
Prepare your virtual environment, install MIASM, and let's start with a new example script provided by MIASM. As you develop the script, you may find it useful to open the sample in a disassembler to understand why it is not executing as desired.
To start with, you can add the default options to introduce the environment required to run our sample:
options.usesegm = True
options.use_windows_structs = True
options.load_hdr = True
options.dependencies = True
Run the script and add the missing WinAPI methods as described in the previous article. For example:
[INFO    ]: kernel32_GetProcAddress(libbase=0x7111e000, fname=0x4293b4) ret addr: 0x40dae2
Traceback (most recent call last):
  File "/home/user/Dev/test_stealc/stage2_loader_miasm.py", line 21, in <module>
    sb.run()
  File "/home/user/Dev/test_stealc/venv/lib/python3.11/site-packages/miasm-0.1.5.dev47-py3.11-linux-x86_64.egg/miasm/analysis/sandbox.py", line 529, in run
    super(Sandbox_Win_x86_32, self).run(addr)
  File "/home/user/Dev/test_stealc/venv/lib/python3.11/site-packages/miasm-0.1.5.dev47-py3.11-linux-x86_64.egg/miasm/analysis/sandbox.py", line 136, in run
    self.jitter.continue_run()
  File "/home/user/Dev/test_stealc/venv/lib/python3.11/site-packages/miasm-0.1.5.dev47-py3.11-linux-x86_64.egg/miasm/jitter/jitload.py", line 430, in continue_run
    return next(self.run_iterator)
           ^^^^^^^^^^^^^^^^^^^^^^^
  File "/home/user/Dev/test_stealc/venv/lib/python3.11/site-packages/miasm-0.1.5.dev47-py3.11-linux-x86_64.egg/miasm/jitter/jitload.py", line 369, in runiter_once
    for res in self.breakpoints_handler.call_callbacks(self.pc, self):
  File "/home/user/Dev/test_stealc/venv/lib/python3.11/site-packages/miasm-0.1.5.dev47-py3.11-linux-x86_64.egg/miasm/jitter/jitload.py", line 129, in call_callbacks
    res = c(*args)
          ^^^^^^^^
  File "/home/user/Dev/test_stealc/venv/lib/python3.11/site-packages/miasm-0.1.5.dev47-py3.11-linux-x86_64.egg/miasm/jitter/jitload.py", line 517, in handle_lib
    raise ValueError('unknown api', hex(jitter.pc), repr(fname))
ValueError: ('unknown api', '0x7111e004', "'api-ms-win-core-synch-l1-2-0_InitializeCriticalSectionEx'")
This function can be implemented as follows:
def InitializeCriticalSectionEx(jitter):
    #api-ms-win-core-synch-l1-2-0_InitializeCriticalSectionEx
    ret_ad, _ = jitter.func_args_stdcall(["lpCriticalSection",
        "dwSpinCount", "Flags"])
    jitter.func_ret_stdcall(ret_ad, 1)
[...]
g = globals()
g['api-ms-win-core-synch-l1-2-0_InitializeCriticalSectionEx'] = InitializeCriticalSectionEx
[...]
sb = Sandbox_Win_x86_32(loc_db, options.filename, options, g)
The principle remains the same for the following methods, which will trigger crashes. You'll get to the interesting part once you've triggered the error for the ws2_32_gethostbyname method. Here's an example of an implementation that displays the domain or IP address sent as a parameter to the method, and returns 127.0.0.1 in the hostent structure so that the program can continue running:
import struct
import logging
from miasm.core.utils import pck32
from miasm.os_dep.common import set_win_str_w, get_win_str_w, get_win_str_a
[...]
log = logging.getLogger("loader_c2_retriever")
console_handler = logging.StreamHandler()
console_handler.setFormatter(logging.Formatter("[%(levelname)-8s]: %(message)s"))
log.addHandler(console_handler)
log.setLevel(logging.INFO)
[...]
def ws2_32_gethostbyname(jitter):
    """
    struct hostent* gethostbyname(
        const char* name
    )
    """
    ret_ad, args = jitter.func_args_stdcall(["name"])
    domain = get_win_str_a(jitter, args.name)
    log.info(f"[>] C2: {domain}")
    ip_str = "127.0.0.1"
    ip = bytes((int(octet) for octet in reversed(ip_str.split('.'))))
    list_item = winobjs.heap.alloc(jitter, len(ip))
    jitter.vm.set_mem(list_item, ip)
    addr_list = winobjs.heap.alloc(jitter, 2 * 8)
    jitter.vm.set_mem(addr_list + 0 * 8, pck32(list_item))
    jitter.vm.set_mem(addr_list + 1 * 8, pck32(0))
    d_nullptr = addr_list + 1 * 8
    hostent_obj = struct.pack(
        "IIHHI",
        args.name,   # h_name
        d_nullptr,   # h_aliases
        2,           # h_addrtype
        len(ip),     # h_length
        addr_list    # h_addr_list
    )
    hostent_addr = winobjs.heap.alloc(jitter, len(hostent_obj))
    jitter.vm.set_mem(hostent_addr, hostent_obj)
    jitter.func_ret_stdcall(ret_ad, hostent_addr)
[...]
You should get the following output:
[INFO ]: [>] C2: 185[.]172.128.90
Continue with the implementation of the ws2_32_ntohs and ws2_32_connect methods. When you reach the ws2_32_send method, you'll be able to retrieve the first HTTP request made by the loader. You can retrieve its contents as follows:
from http.server import BaseHTTPRequestHandler
from io import BytesIO
[...]
class HTTPRequest(BaseHTTPRequestHandler):
    def __init__(self, request_text):
        self.rfile = BytesIO(request_text)
        self.raw_requestline = self.rfile.readline()
        self.error_code = self.error_message = None
        self.parse_request()

    def send_error(self, code, message):
        self.error_code = code
        self.error_message = message

def ws2_32_send(jitter):
    """
    [SocketCode-int] send(
        SOCKET s,
        LPVOID buf,
        int len,
        [SendRecvFlags] flags
    )
    """
    ret_ad, args = jitter.func_args_stdcall(["s", "buf", "len", "flags"])
    data_to_send = jitter.vm.get_mem(args.buf, args.len)
    log.debug(f"[>] Data sent to the server:\n{data_to_send}")
    try:
        request = HTTPRequest(data_to_send)
        host = request.headers['host']
        path = request.path
        protocol = ""
        if LAST_SOCKET_PORT == 80:
            protocol = "http://"
        log.info(f"[>] Requested URL : {protocol}{host}:{LAST_SOCKET_PORT}{path}")
    except:
        pass
    jitter.func_ret_stdcall(ret_ad, args.len)
This gives you the following output:
[INFO ]: [>] Requested URL : hxxp://185[.]172.128.90:80/cpa/ping.php?substr=0&s=ab&sub=0
You then need to implement the ws2_32_recv method so that the loader can validate that the request has been passed to continue execution.
You can stop development when you reach the kernel32_DeleteCriticalSection method. You can then disable MIASM's verbosity to display only relevant information:
# Disable miasm log
logging.getLogger("jit function call").disabled = True
logging.getLogger("loader_common").disabled = True
logging.getLogger("loader_pe").disabled = True
logging.getLogger("seh_helper").disabled = True
This gives you the following result:
[INFO ]: [>] C2: 185.172.128[.]90
[INFO ]: [>] C2 port : 80
[INFO ]: [>] Requested URL : hxxp://185[.]172.128.90:80/cpa/ping.php?substr=0&s=ab&sub=0
[INFO ]: [>] C2: 185.172.128[.]228
[INFO ]: [>] C2 port : 80
[INFO ]: [>] Requested URL : hxxp://185.172[.]128.228:80/ping.php?substr=0
[INFO ]: [>] C2: 185.172[.]128.59
[INFO ]: [>] C2 port : 80
[INFO ]: [>] Requested URL : hxxp://185[.]172.128.59:80/syncUpd.exe
You will find the complete code that produced the above result here.
In the next chapter, we'll find out what's behind the syncUpd.exe program (stage 3).
05 - Analysis of Stage 3
Stage 3 information
Once we've retrieved the sample from the malicious actor's C2, we can begin analyzing it without further ado.
Here's the information about the sample we will analyze in this chapter:
| Type | Data |
|---|---|
| SHA256 | b1a73a20fb4a434c77aeabd506a0995b8c7c22bbbb4824584cdecb63ca198291 |
| SHA1 | 381bf37ae4c081752a3e62b1d5ee612ea4c0595c |
| MD5 | 28b12dbd2041c716ad7d8525d58b7f42 |
| File size | 271 872 bytes |
| First seen | 2024-04-30 13:00:51 UTC (VT) |
| MIME type | application/x-dosexec |
| imphash | 6238cdaa05523d29a8e8e1952e0934c6 |
| ssdeep | 3072:Km3ix/rp+xVl7hDB+R+z/+gT0J+QWNKiwfAZtvcX8VP3YsxG8fjxWo3tIIbbJZ:SjUPNhV+RngT1DLvWy33giWo3tI |
The executable is present on VirusTotal and has a high detection ratio. We can run a Yara scan on the file and identify known markers. It turns out that the executable matches a rule we wrote in this article (pkr_ce1a):
$ yara -s Packer_pkr_ce1a.yar ./syncUpd.exe
Packer_pkr_ce1a_generic ./Dev/test_stealc/syncUpd.exe
0x187ef:$shellcode_size: 00 69 9A F9 74 C5 32 00 00 96 AA CB 46 00
0x187c3:$shellcode_addr: 00 94 48 8D 6A 6D 98 40 00 F2 16 0B 68 00
0x88b:$tea_const_delta: B9 79 37 9E
0x837:$tea_sum_calculated1: 81 01 E1 34 EF C6
We're back to identifying the shellcode and cryptographic constants of the TEA algorithm!
Unpacking stage 3
As we took the time to implement an unpacker with MIASM in Chapter 1, we're going to reuse it to unpack the sample. We can see that the program fits into new anti-emulation methods:
....
[INFO    ]: kernel32_EncodePointer(0x20009010) ret addr: 0x403688
[INFO    ]: kernel32_LeaveCriticalSection(lpCriticalSection=0x430568) ret addr: 0x406f96
[INFO    ]: kernel32_GetTickCount() ret addr: 0x401cb4
[INFO    ]: kernel32_SetLastError(errcode=0x0) ret addr: 0x401cbb
[INFO    ]: kernel32_GetTickCount() ret addr: 0x401cb4
[INFO    ]: kernel32_SetLastError(errcode=0x0) ret addr: 0x401cbb
[INFO    ]: kernel32_GetTickCount() ret addr: 0x401cb4
[INFO    ]: kernel32_SetLastError(errcode=0x0) ret addr: 0x401cbb
[INFO    ]: kernel32_GetTickCount() ret addr: 0x401cb4
[INFO    ]: kernel32_SetLastError(errcode=0x0) ret addr: 0x401cbb
[INFO    ]: kernel32_GetTickCount() ret addr: 0x401cb4
[INFO    ]: kernel32_SetLastError(errcode=0x0) ret addr: 0x401cbb
[INFO    ]: kernel32_GetTickCount() ret addr: 0x401cb4
[INFO    ]: kernel32_SetLastError(errcode=0x0) ret addr: 0x401cbb
[INFO    ]: kernel32_GetTickCount() ret addr: 0x401cb4
[INFO    ]: kernel32_SetLastError(errcode=0x0) ret addr: 0x401cbb
[INFO    ]: kernel32_GetTickCount() ret addr: 0x401cb4
....
If we compare the impacted code portions using a tool such as BinDiff, we find our anti-emulation loop, except that the arguments sent as parameters are not the same. As a result, the WinAPI methods are different too:
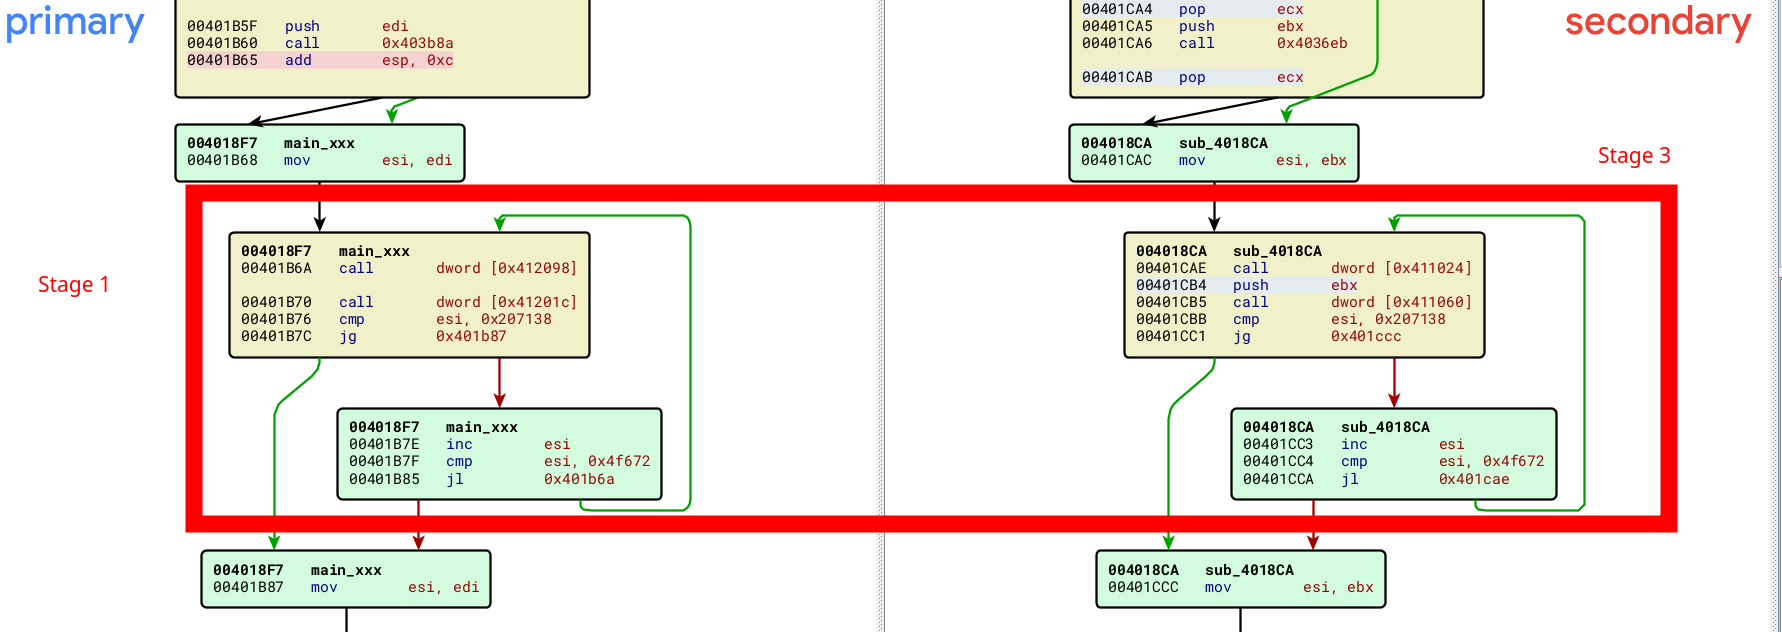
In Stage 1, the GetCurrentProcessId and GetCurrentProcess methods were used. In Stage 3, these methods have been replaced by GetTickCount and SetLastError.
Another example:
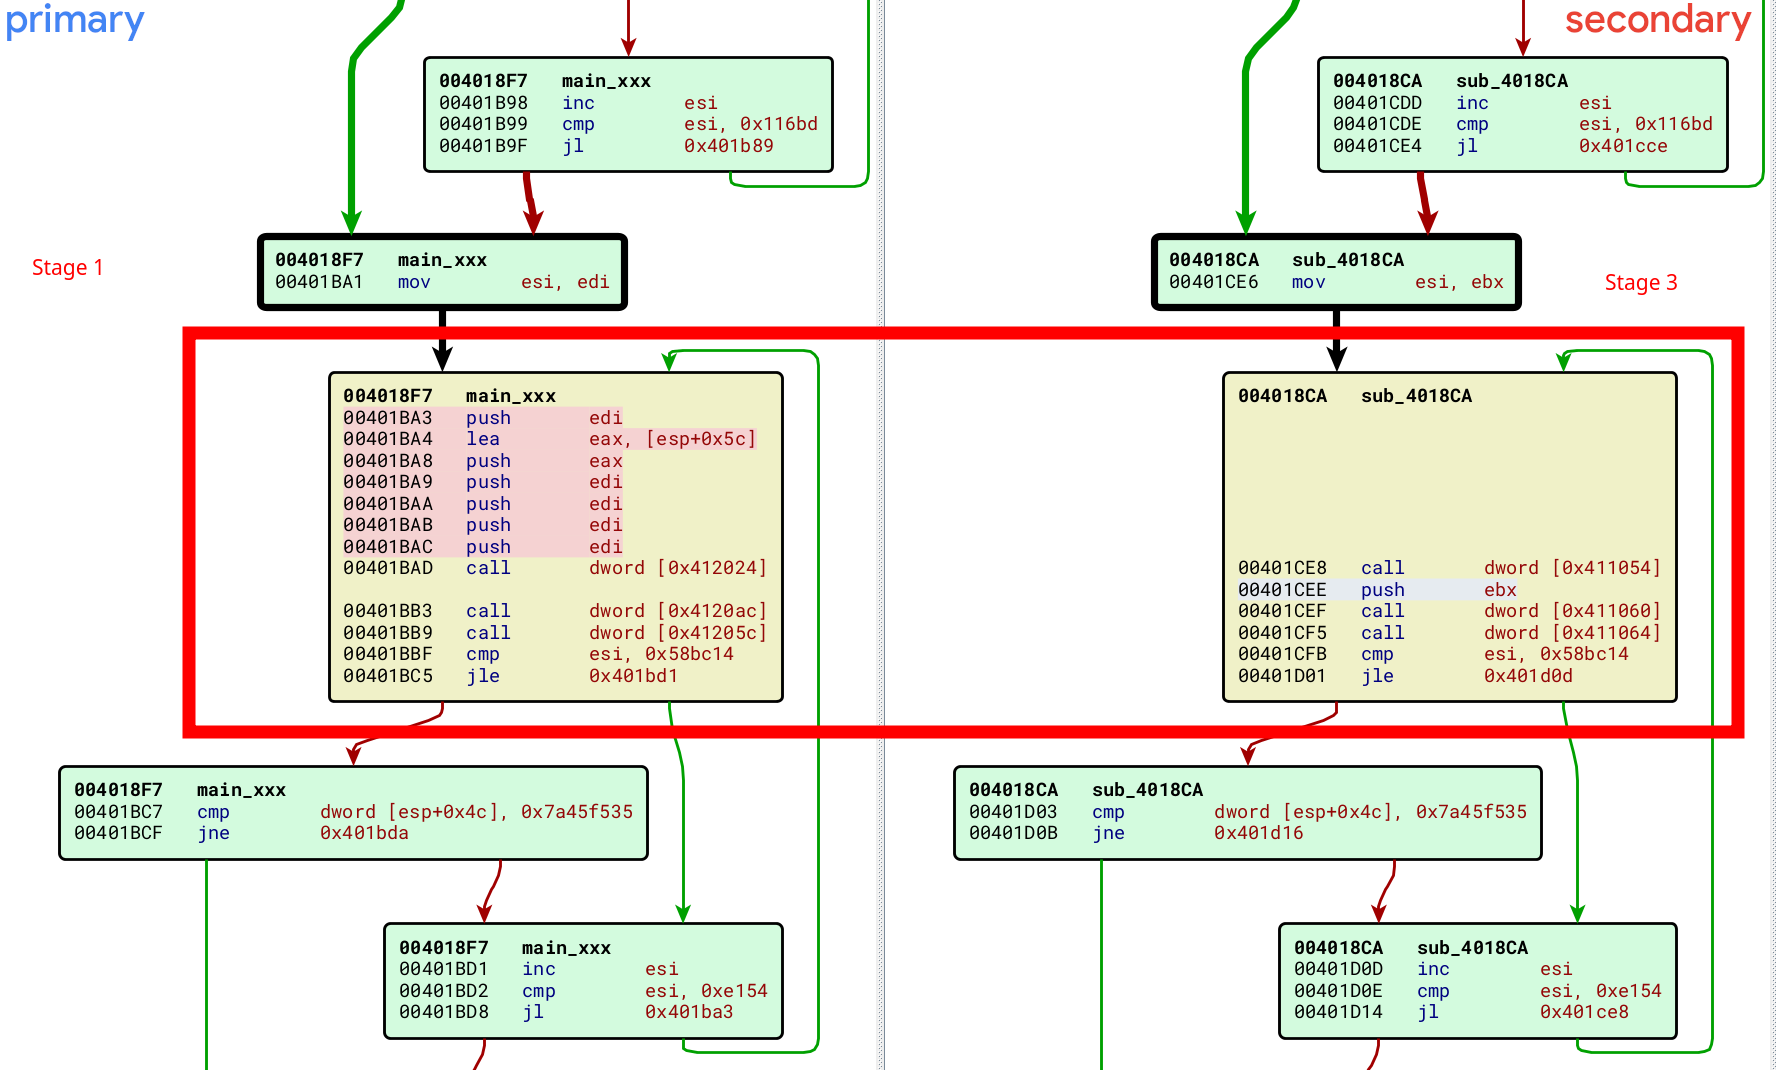
It seems that the malicious actor is changing the WinAPI methods used for anti-emulation. We could improve our anti-emulation bypass to be more generic, for example by identifying the loop using common instructions or constants. The latest basic blocks seem to contain fixed constants with the values 0x7a45f535 and 0xe154. The packer may evolve and change these values. It may be preferable to use several identification criteria.
For the purposes of this article, we're not going to opt for a perfect method. Here we're just going to get around anti-emulation by changing the return addresses or changing the values of specific registers:
#
#   Stage 3 (b1a73a20fb4a434c77aeabd506a0995b8c7c22bbbb4824584cdecb63ca198291)
#

def kernel32_GetTickCount(jitter):
    ret_ad, _ = jitter.func_args_stdcall(0)
    winobjs.tickcount += 1
    # AntiEmulation @0x00401cae (b1a73a20fb4a434c77aeabd506a0995b8c7c22bbbb4824584cdecb63ca198291)
    if ret_ad == 0x00401cb4:
        ret_ad = 0x00401d16
    jitter.func_ret_stdcall(ret_ad, winobjs.tickcount)

def kernel32_GetLastError(jitter):
    ret_ad, _ = jitter.func_args_stdcall(0)
    # AntiEmulation @0x00401708 (b1a73a20fb4a434c77aeabd506a0995b8c7c22bbbb4824584cdecb63ca198291)
    if ret_ad == 0x40170e: # anti emu
        jitter.cpu.EDI = 0x1
    jitter.func_ret_stdcall(ret_ad, winobjs.lastwin32error)

def kernel32_SetLastError(jitter):
    ret_ad, args = jitter.func_args_stdcall(["errcode"])
    # AntiEmulation @0x004017ca (b1a73a20fb4a434c77aeabd506a0995b8c7c22bbbb4824584cdecb63ca198291)
    if ret_ad == 0x4017d0: # anti emu
        if jitter.cpu.EDI > 0x62:
            ret_ad = 0x004017e3
        else:
            jitter.cpu.EDI = 0x62
        print(hex(jitter.cpu.EDI))
    winobjs.lastwin32error = args.errcode
    jitter.func_ret_stdcall(ret_ad, 0)
Once the new code has been executed, you should be able to extract a new sample:
[INFO    ]: kernel32_VirtualProtect(lpvoid=0x400000, dwsize=0x23b000, flnewprotect=0x40, lpfloldprotect=0x13e004) ret addr: 0x200242e6
[WARNING ]: set page 400000 7
[WARNING ]: set page 401000 7
[WARNING ]: set page 411000 7
[WARNING ]: create page 419000 7
[WARNING ]: create page 63b000 7
[INFO    ]: kernel32_VirtualFree(lpvoid=0x2004b000, dwsize=0x0, alloc_type=0x8000) ret addr: 0x20024446
PE unpacked : 'syncUpd_exe_miasm_unpacked.bin' (Region : 0x2004b000)
Let's check the magic of this file:
$ file syncUpd_exe_miasm_unpacked.bin
syncUpd_exe_miasm_unpacked.bin: PE32 executable (GUI) Intel 80386, for MS Windows, 4 sections
The complete code for unpacking syncUpd.exe is available here.
We can now go on to the next article to see what's behind the program we've just extracted.