01 - Introduction
This series of blog posts is aimed at a technical audience interested in reverse engineering and, more specifically, malware analysis.
In this article, we'll take a look at the analysis of a malicious sample for Windows from the StealC family, from the packed sample to the recovery of C2.
We'll automate our analysis steps with a view to integrating them into an automated pipeline for extracting indicators of compromise.
In the second article we'll retrieve C2 from the loader, get the third stage sample and unpack it.
The third article will focus on the last stage (StealC malware) and C2 recovery using static analysis.
Requirements
The prerequisites for this articles are :
- Knowledge of reverse engineering on malicious programs
- Basic knowledge of x86 assembler
- Knowledge of C/Cpp is strongly recommended
- Knowledge of Python is required for automation
- Knowledge of a disassembler (Binary Ninja, IDA, Ghidra)
- Experience of opening malware in a disassembler
- Experience with a debugger (x64dbg/WinDBG...)
- Motivation and a few liters of coffee
02 - Reminders and preparation of the analysis environment
Some definitions
In order to follow this article, you need to be familiar with the vocabulary of malware analysis.
A sandbox
A sandbox is a solution for detonating (executing) a malicious program in a controlled environment. The purpose of this solution is to help you understand how a malicious program works. I invite you to find out for yourself about this fascinating subject, as it can save you precious time when you're under time pressure.
It's worth noting that some malware programs have features that can detect whether they are running in this type of environment, so as not to execute the malicious payload and thwart detection.
Open-source (CapeSandbox, Drakfuf Sanbox...) and proprietary (AnyRun, JoeSandbox...) sandboxes are available. Your choice of sandbox depends on the level of discretion you require when analyzing malware. In fact, some sandboxes collect the samples you send them and make them available to a more or less restricted audience, as is the case with some free online sandboxes. If you need to maintain a high level of discretion, you should opt for a sandbox that can be hosted on your premises, and disable all telemetry options or, even more radically, cut off access to the Internet.
A command and control server
A command and control server, also known as C2 or CnC (Command and Control), is a server belonging to a malicious actor, enabling them to collect and even interact with an agent (malware) installed on an infected workstation.
The C2 of a malicious program is very often requested from a malware analyst with the aim of adding it in detection and network flow equipments (e.g. firewalls, SIEMs, etc.).
The C2 of a malicious program can, for example, be identified as a domain or an IP address.
A packer
A packer is generally the name given to a tool that compresses and potentially obfuscates an original program. A packer can be used legitimately by software publishers to protect intellectual property. Malicious programs are regularly packed to bypass static detection systems.
A packer can incorporate obfuscation, anti-emulation, anti-VM and anti-debugging techniques. The packer studied in this blog post will contain only anti-emulation and obfuscation methods.
There are open-source packers and obfuscators available on Github, and other proprietary ones (e.g. Tigress, VMProtect).
An emulator (symbolic execution)
In the context of reverse engineering, an emulator simulates the behavior of a program or a sequence of instructions by reproducing the execution context (CPU register, memory, etc.). Emulation does not deliver the same performance as a virtual machine, because the program instructions are not executed directly by the processor, but simulated.
Among other things, emulation makes it possible to bypass specific anti-debug or anti-VM mechanisms that may be implemented in programs. On the other hand, some programs use anti-emulation. Anti-emulation can be characterized by the presence of dead code (useless code) that requires a quite a few of execution time, e.g. a loop that calls a useless function. A normal CPU would take a fraction of a second to execute, whereas an emulator can take several minutes.
Emulators are present in detection systems such as antivirus software. The latter analyzes the behavior of programs by emulating them. If anti-emulation techniques are present in the program and are not thwarted by the emulator, the emulation may then terminate in timeout.
Some open-source emulators allow symbolic execution of Windows PEs, such as MIASM, Qiling, Triton or SpeakEasy.
Analysis tools
For malware analysis, we strongly recommend using a virtual environment. You can use the hypervisor of your choice (e.g. VMWare, Virtualbox, KVM). It can be useful to use different systems, as some malware only work on specific systems. For example, you may have a Windows 7 machine and a Windows 10 machine. Once your machine is installed, you can install analysis tools, a disassembler, a debugger, dynamic analysis tools, and a development and compilation environment.
Below is a non-exhaustive list of tools that may be useful for your analyses:
- Sysinternal Suite (procmon, processexplorer, autoruns, tcpview...)
- Detect It Easy
- PEStudio
- DNSpy (if you come across .NET)
- PE-Bear
- Floss
Isolate your machine from the network to prevent any connection to the outside world. Unless you're using a system such as inetsim, disable network interface completely.
Make a snapshot of your virtual machine in a healthy state once all your analysis tools are installed and configured, so that you can return to a healthy state at any time.
Set up a system enabling you to transfer files between your host and your virtual system. Be careful to restrict access to an empty directory or one with no critical data (some ransomware encrypts file shares). If in doubt, disable file sharing completely once you've transferred the malicious sample to the virtual machine.
Make regular snapshots as you progress through the analyses, so that you can keep a record of your progress.
A disassembler
There are several disassemblers on the market, but the one that seems to be the most widely used in professional environments today is IDA Pro. It costs a quite a few of money, especially if you need a decompiler for a specific architecture. It has a built-in debugger and an API to automate your analysis, as well as a number of open-source plugins available on Github.
In this article we use Binary Ninja, which has the same features as the IDA Pro tool, but at a much more affordable price. Binary Ninja has an active community and responsive bug-fixing support. Its integrated plugin manager lets you quickly install and configure plugins.
If you want to stay in the free world, there are disassemblers such as:
- Radare with its graphical interface iaito (or the fork Rizin with Cutter GUI)
- Ghidra, a disassembler initially developed by the NSA using the Java language
A debugger
When you want to debug a program on Windows, you can use a debugger. Windows provides its own debugger, WinDBG.
There's also a relief for OllyDBG (for the oldest among you) called x64dbg. It has a large number of useful plugins for your reverse sessions. Some useful plugins for malware analysis:
- https://github.com/x64dbg/ScyllaHide
- https://github.com/buzzer-re/x64dbg-ASLR-Removal
- https://github.com/therealdreg/DbgChild
Initial sample (Stage 1)
Open source research
Where to start
The aim of the open-source research phase is to gather the information you need for your analyses. When you're analyzing a malicious sample, it's possible that some people have already studied the sample, or at least the malware family. If you're dealing with a totally unknown sample, grab your knowledge, some tools, a few liters of coffee and get started! The malicious actor who developed the malicious sample aims to discourage you, waste your time and make you give up.
Take the time to read blog articles on malicious sample analysis, attend or watch replays of conferences on the subject (e.g. Botconf, Virus Bulletin), monitor social networks such as Twitter/X.
Another very useful platform for your malware research is Malpedia. It categorizes malware families by actor and provides samples, Yara rules and links to external articles.
Sample recovery
In this article, we've chosen an arbitrarily selected sample for you. The sample was part of one of the last submissions on Malware Bazaar (malicious sample sharing platform) by user zbetcheckin. This sample has been categorized as part of the StealC family. The program appears to be detected by 58 antivirus programs.
A search in Malpedia tells us that StealC:
- is a Malware-as-a-Service
- has existed since january 2023
- was written in C
- collects information on:
- web browsers
- cryptographic wallets
- instant message software and emails
- communicates with its C2 using HTTP POST requests
Two Yara rules are supplied: win_stealc_auto and win_stealc_w0. These date from 2023. We can put them aside for later, as they'll come in handy. Blog posts are also available - feel free to have a look if you want to understand some of the grey areas.
Here's some information about the sample we'll be looking at in this article:
| Type | Data |
|---|---|
| SHA256 | c173cfcb0adfa3013a398638789bf4350601cce0e1c55a456d98311543062f82 |
| SHA1 | 87e5501bbc72be1d0b763acec9bf08c9db26a8d1 |
| MD5 | 51e5979460e5a9dc941c03bc76cc3855 |
| File size | 455'681 bytes |
| First seen | 2024-04-08 07:13:32 UTC (Malware Bazaar) |
| MIME type | application/x-dosexec |
| imphash | 9ee9346826f4cfd6b39a524a25cdc5de |
| ssdeep | 12288:f9zyluCg7RvcQ7tZRsuPE16N0N9k9ptHMF:PCg7RvcKKnitHMF |
User zbetcheckin indicates the origin of the malware in a comment on Malware Bazaar:

The URL in the comment can be used to extract the following indicators of compromise:
| Type | Data |
|---|---|
| IPv4 | 185.172.128[.]59 |
| Filename | ISetup8.exe |
| URL | hxxp://185.172[.]128.59/ISetup8.exe |
By digging deeper into these indicators of compromise, it would be possible to retrieve more information on the infrastructure of the malicious actor. For example, we could retrieve the AS (autonomous system) associated with the IP address and pivot using this information. But this is beyond the scope of this article.
We can retrieve the malicious sample via open sources such as Malware Bazaar, VirusTotal (requires an appropriate license) or directly from the infrastructure of the malicious actor if the latter has not shut down its service. If you plan to retrieve a sample from the infrastructure of a malicious actor, we strongly recommend that you use at least one bounce to connect to it (e.g. Tor, VPN, even a proxy).
The files can be recovered here. Malicious samples are contained in password-protected ZIP archives. The password used for these archives is the one most commonly used when exchanging malicious files: infected
Packer identification
If you have not yet configured your machine, please refer to the chapter Reminders and preparation of the analysis environment in this article. Now that you have the sample on your analysis system, make sure you have shut down the network.
Entropy
With Binary Ninja
If you want to save time and you own Binary Ninja, you can open our .bndb file.
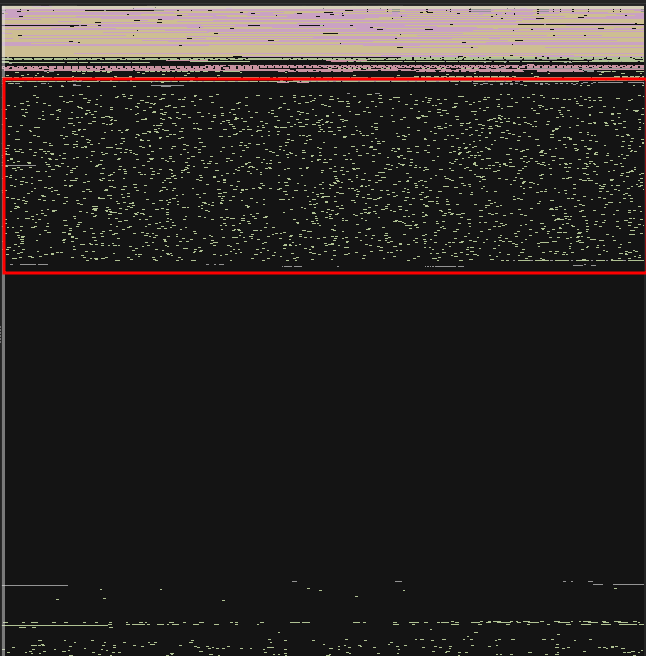
If we look at the binary data graph, we can see that a large part of the program contains data that cannot be understood by the disassembler:
You can get an entropy score with the get_entropy method of the Binary Ninja API:
>>> for section in bv.sections:
...     sec = bv.get_section_by_name(section)
...     print(f"Section '{section}': {bv.get_entropy(sec.start, sec.start)}")
...
Section '.data': [0.446795254945755]
Section '.extern': [0.0]
Section '.rdata': [0.6443907618522644]
Section '.rsrc': [0.5072780251502991]
Section '.synthetic_builtins': [0.0]
Section '.text': [0.839885950088501]
With Detect It Easy
You can also check the entropy of the binary with another tool such as Detect It Easy. With this tool, you can see that the .data and .text sections have a rather high entropy level:

With Yara
Another less precise way of identifying whether a program is packed is to use Yara's math.entropy module.
import "math"

rule PE_High_entropy
{
    condition:
        uint16(0) == 0x5A4D and
        uint32(uint32(0x3C)) == 0x00004550 and
        math.entropy(0, filesize) > 6.5
}
Unpack sample manually
If you're faced with this type of packer and you're in a hurry, it may be necessary to unpack it manually if no automated solution exists.
It is common for packers to use memory allocation methods such as VirtualAlloc, then add execution permissions to this memory area with VirtualProtect. Once the memory area has been allocated, the packers retrieve the encrypted second stage. The second stage may, for example, be present in the program resources. The packer then uses decryption or decoding alrogithms to decrypt the second stage and execute it.
One way of extracting the packed program is to set write hardware breakpoints on memory areas freshly allocated by methods such as VirtualAlloc and then identify the decryption routine. Once the decryption loop has passed, you can extract the memory area. Note that this type of case does not always work.
The pkr_ce1a packer uses the VirtualAlloc method, decrypts the second layer and adds a few modifications to it, then releases the memory area with VirtualFree.
Memory allocation
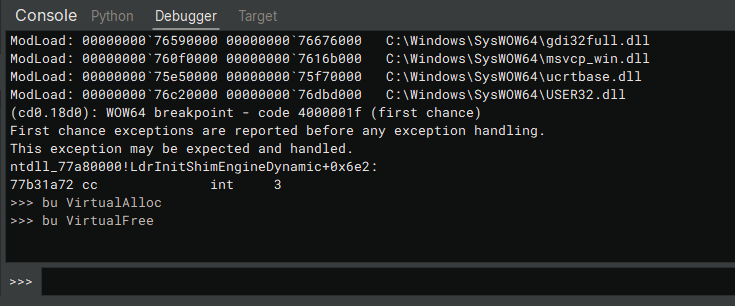
To get started, set up your favorite debugger in a virtual machine isolated from the network and any file sharing. Set a breakpoint on the VirtualAlloc and VirtualFree methods of the Kernel32.dll library. Each packer has its own way of extracting. Adapt the various steps to your technical environment.
If you're using Binary Ninja or a WinDBG base, you can set a breakpoint on specific methods once you've reached the entry point of your program. The command is bu kernel32.dll!VirtualAlloc:
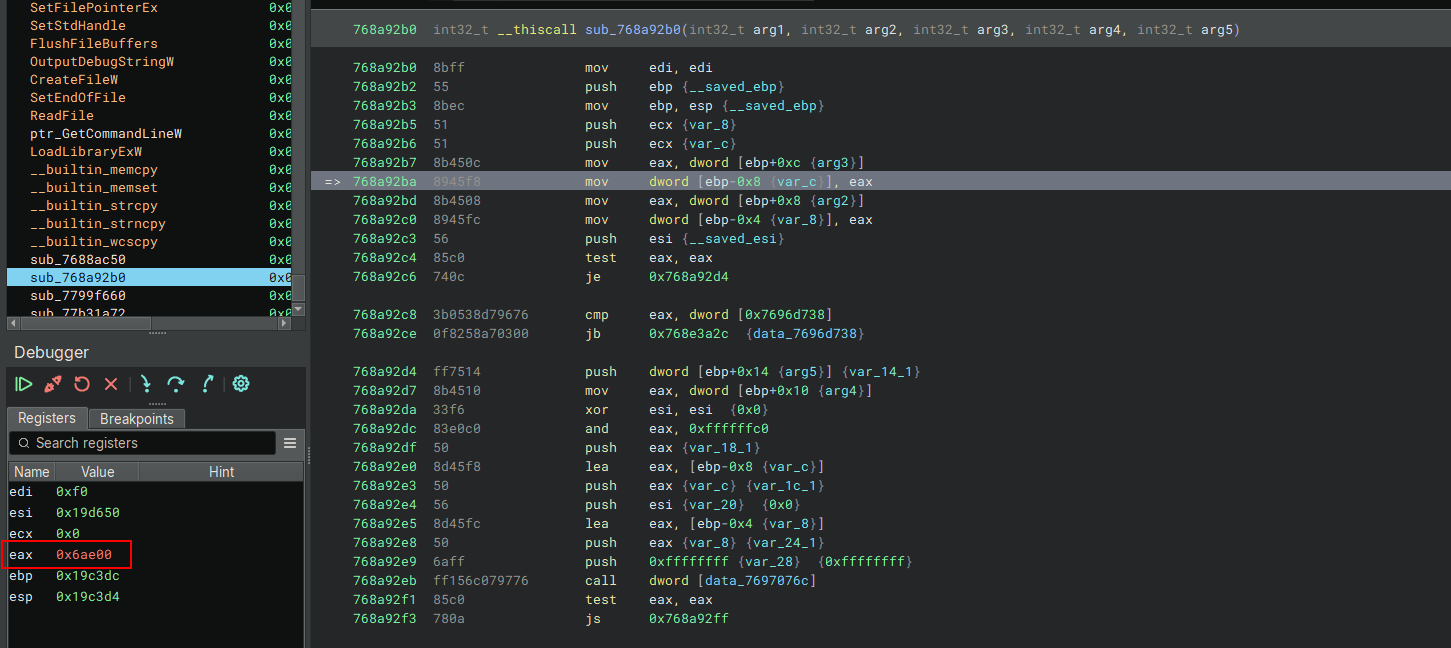
Continue program execution (F9) until the breakpoint is triggered. Get the size of the VirtualAlloc argument. Here the argument sent to the function is pushed onto the stack and then stored in the eax register (0x6ae00) in the VirtualAlloc function.
To get the return address, continue to the function return (CTRL+F9 in binary ninja). This will give us the address of the memory area allocated by VirtualAlloc in 0x21a0000. This address will not necessarily be the same on your environment:

Save the starting address of the memory area, and its size for later usage. Continue executing the program until you call the VirtualFree (F9) method:

PE extraction
Before extracting the PE, you can retrieve the first two bytes and make sure it's a Windows executable and has the MZ header:

You can then dump the memory area and save it on your filesystem. Below is the code you can adapt to the memory address allocated by your system and the path where you wish to save the unpacked program:
import base64
pe_data = dbg.read_memory(0x21a0000, 0x6ae00).base64_encode()
f = open(r"C:\Users\user\Desktop\pe_unpacked.bin", "wb")
f.write(base64.b64decode(pe_data))
f.close()
Once done, you can open it in a tool such as Detect It Easy to check its validity:
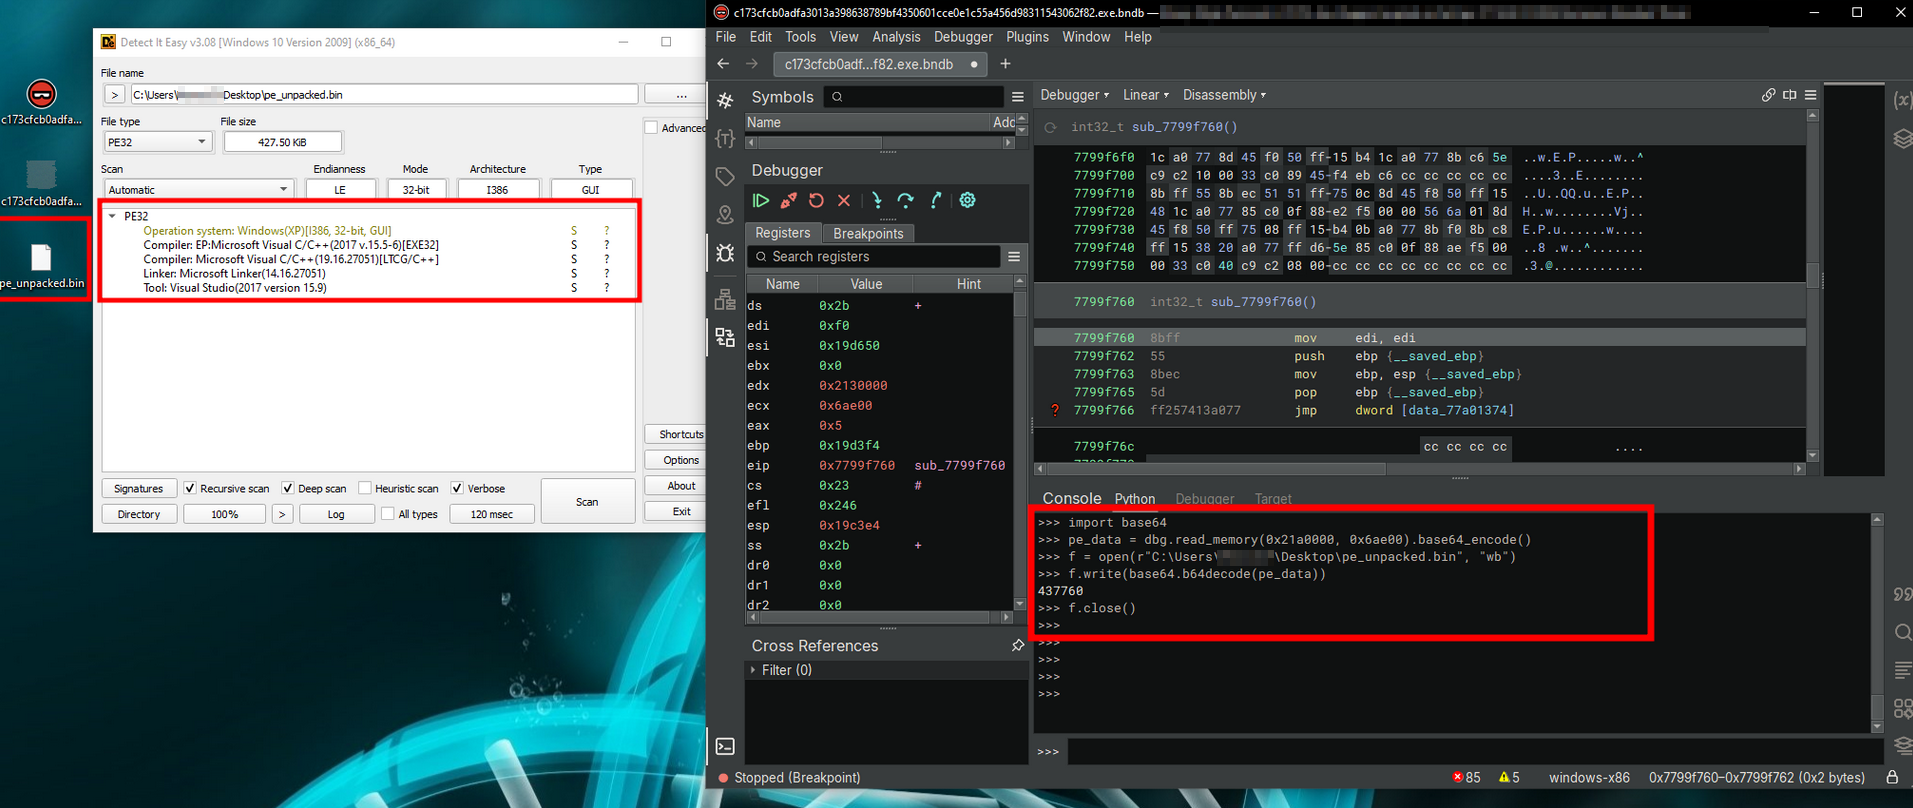
Bravo, you've just unpacked the first Stage! \o/
Identifying elements in the packer
Cryptographic functions
A packer can use cryptographic functions to hide/unhide code. You can use Yara or plug-ins built into your disassembler to identify cryptographic constants.
For IDA, you can use Findcrypt-yara. With Binary Ninja, you can use CryptoScan:

A cryptographic constant from the TEA algorithm seems to be used in 0x4014c3, so let's take a closer look. We can start by renaming the variables and removing the dead code (garbage) present in this function:
0040146e  int32_t __fastcall xx_decode_shellcode_TEA(int32_t* memory_area)

00401477      int32_t blob_length2_1 = blob_length2
00401485      int32_t data_1 = *memory_area
00401487      int32_t data_2 = memory_area[1]
0040148a      int32_t previous_data_1 = data_1
00401493      if (blob_length2_1 == 0x594)
004014a0          void lpFilename  // Garbage
004014a0          GetModuleFileNameW(hModule: nullptr, lpFilename: &lpFilename, nSize: 0)
004014a6          blob_length2_1 = blob_length2
004014ac      int32_t key1_1 = key1
004014b4      int32_t key_1 = 0
004014bb      int32_t key2_1 = key2
004014c0      int32_t delta = 0x9e3779b9 // Crypto constant identified by CryptoScan
004014ca      add_ecx_content_0xc6ef34e1(&key_1) // Second crypto constant calculated
004014cf      key_1 += 0x23f
004014d9      void lpszVolumeName
004014d9      if (blob_length2_1 == 0x14)
004014e6          // Garbage
004014e6          FindNextVolumeA(hFindVolume: nullptr, lpszVolumeName: &lpszVolumeName, cchBufferLength: 0)
004014ec      int32_t data_3 = key3
004014f2      int32_t data_6 = key4
004014f9      int32_t data = data_3
004014ff      int32_t loop_counter = 0x20
00401643      int32_t loop_index
00401643      do
00401500          int32_t var_18_1 = 2
00401507          char shift_amount_2 = 5
00401521          int32_t temp_key = key_1
00401527          int32_t temp_data_7 = data_4c1b48
0040152c          if (blob_length2 == 0xfa9)  // Garbage
0040152c              temp_data_7 = 0xedeb2e40
00401531          bool cond:2_1 = blob_length2 == 0x3eb
0040153b          data_4c1b48 = temp_data_7
00401540          int32_t temp_data_8 = data_4c1aa0
00401545          if (cond:2_1)
00401545              temp_data_8 = 0
0040154a          data_4c1aa0 = temp_data_8
0040155e          int32_t temp_data_9 = ((data_1 << 4) + data_3) ^ (temp_key + data_1)
00401565          data_4c1b44 = 0xf4ea3dee
00401579          int32_t shift_result = temp_data_9
0040157f          if (blob_length2 == 0x213)  // Garbage
00401586              CreateHardLinkW(lpFileName: nullptr, lpExistingFileName: nullptr, lpSecurityAttributes: nullptr)
0040158e              IsValidCodePage(CodePage: 0)
0040159a              uint8_t* var_28
0040159a              GetCompressedFileSizeW(lpFileName: nullptr, lpFileSizeHigh: &var_28)
004015ad              void lpBaseAddress
004015ad              WriteProcessMemory(hProcess: nullptr, lpBaseAddress: &lpBaseAddress, lpBuffer: nullptr, nSize: 0, lpNumberOfBytesWritten: nullptr)
004015b8              GetNumaProcessorNode(Processor: 0, NodeNumber: var_28)
004015ca              void lpBuffer
004015ca              void lpNumberOfEventsRead
004015ca              ReadConsoleInputA(hConsoleInput: nullptr, lpBuffer: &lpBuffer, nLength: 0, lpNumberOfEventsRead: &lpNumberOfEventsRead)
004015d5              DeleteTimerQueueTimer(TimerQueue: nullptr, Timer: nullptr, CompletionEvent: nullptr)
004015de          data_2 -= ((previous_data_1 u>> 5) + data_6) ^ temp_data_9
004015f8          int32_t xor_result_1 = (data_2 u>> shift_amount_2) + key2_1
00401606          int32_t temp_data_11 = ((data_2 << 4) + key1_1) ^ (key_1 + data_2)
00401615          int32_t xor_result  // Garbage
00401615          if (blob_length2 != 0xb03)
00401625              xor_result = xor_result_1
00401615          else  // Garbage
00401617              GetConsoleAliasExesLengthA()
00401620              xor_result = xor_result_1
00401628          int32_t temp_data_12 = temp_data_11 ^ xor_result
0040162c          int32_t result_1 = temp_data_12
00401634          data_1 = add(data_1, temp_data_12)
00401636          previous_data_1 = data_1
0040163c          key_1 -= delta
0040163f          data_3 = data
00401642          loop_index = loop_counter
00401642          loop_counter -= 1
00401643      while (loop_index != 1)
0040164c      *memory_area = data_1
0040164f      memory_area[1] = data_2
00401657      return delta
We can see that the encryption keys are directly integrated into the function:

Starting from the following C code:
void decrypt (uint32_t v[2], const uint32_t k[4]) {
    uint32_t v0=v[0], v1=v[1], sum=0xC6EF3720, i;  /* set up; sum is (delta << 5) & 0xFFFFFFFF */
    uint32_t delta=0x9E3779B9;                     /* a key schedule constant */
    uint32_t k0=k[0], k1=k[1], k2=k[2], k3=k[3];   /* cache key */
    for (i=0; i<32; i++) {                         /* basic cycle start */
        v1 -= ((v0<<4) + k2) ^ (v0 + sum) ^ ((v0>>5) + k3);
        v0 -= ((v1<<4) + k0) ^ (v1 + sum) ^ ((v1>>5) + k1);
        sum -= delta;
    }                                              /* end cycle */
    v[0]=v0; v[1]=v1;
}
It can be transcribed into python and the encryption keys added:
KEY = [0x1ed822c8, 0x1eda8d45, 0x6fd0bf39, 0x19ea64a5]

def tea_decipher(v):
    y = c_uint32(v[0])
    z = c_uint32(v[1])
    sum = c_uint32(0xc6ef3720)
    delta = 0x9e3779b9
    n = 32
    w = [0,0]
    while(n>0):
        z.value -= ( y.value << 4 ) + KEY[2] ^ y.value + sum.value ^ ( y.value >> 5 ) + KEY[3]
        y.value -= ( z.value << 4 ) + KEY[0] ^ z.value + sum.value ^ ( z.value >> 5 ) + KEY[1]
        sum.value -= delta
        n -= 1
    w[0] = y.value
    w[1] = z.value
    return w
The function that calls our xx_decode_TEA function (renamed by us) seems to decode an entire buffer:

A search on a search engine allows us to put a name to our packer thanks to an article from Elemental X:

Identify the shellcode call
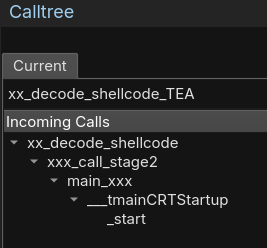
If we go back to the Calltree of our xx_decode_shellcode_TEA decryption function, we can see that the function is called by xx_decode_shellcode, which decrypts a buffer, and then by a xxx_call_stage2 function in 0x004016ca:
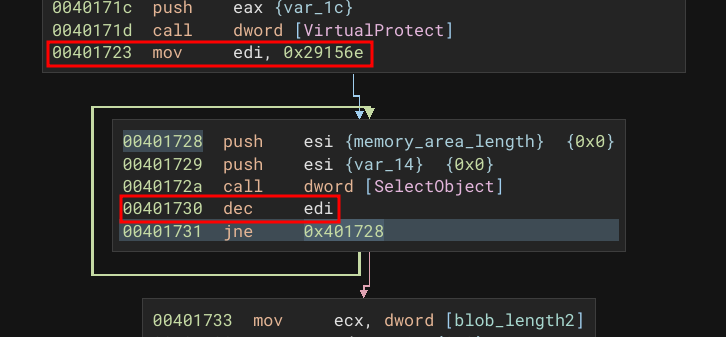
If you look at the code in the xxx_call_stage2 function, you'll see a lot of unnecessary code and anti-emulation. For example, the code below shows a loop that performs 0x29156e rounds by calling the WinAPI method SelectObject. NULL values are sent to it, and the return of the function is not even checked. This type of call considerably slows down program execution in an emulator.
Writing a Yara rule for the packer
Now that we have a name for our pkr_ce1a packer, we can search the Internet for existing Yara rules. Malwarology has wrote a very good blog post on analyzing the packer.
They also provide two Yara rules, one that retrieves the size of a shellcode and the other that retrieves the shellcode address.
 strings:
        $shellcode_size = { 00699AF974[4]96AACB4600 }
        $shellcode_addr = { 0094488D6A[4]F2160B6800 }
We can search for these sequences of bytes in our binary and rename the variables accordingly in our disassembler. In this sample, the shellcode address is 0x41f0e8 and the size pointer is 0x41eef3.
In addition to the two strings of the Malwarology rules, we're adding other parameters that we've identified from the start to reduce the number of false positives:
- TEA cryptographic constants
- an entropy check to increase the likelihood of it being a packed program
This can give us the following rule:
import "math"
import "pe"

rule Packer_pkr_ce1a_generic
{
    meta:
        date = "2024-04-25"
        description = "Detect pkr_ce1a packer"
        sharing = "TLP:CLEAR"
        example = "c173cfcb0adfa3013a398638789bf4350601cce0e1c55a456d98311543062f82"
        packer = "pkr_ce1a"
    strings:

        // First stage shellcode size: 0x41ef1f
        $shellcode_size = { 00699AF974[4]96AACB4600 }

        // First stage shellcode addr: 0x41eef3
        $shellcode_addr = { 0094488D6A[4]F2160B6800 }

        // delta TEA algorithm : 0x004014c0
        $tea_const_delta = { B979379E }

        // sum TRA algorithm : Not found in this sample
        $tea_const_sum = { 2037EFC6 }

        /*
            // The tea sum is calculated; perhaps some samples don't have this implementation.
            004014b1  8d4df8             lea     ecx, [ebp-0x8 {key_1}]
            00401462  8101e134efc6       add     dword [ecx], 0xc6ef34e1
            004014cf  8145f83f020000     add     dword [ebp-0x8 {key_1}], 0x23f
        */
        $tea_sum_calculated1 = { 8101E134EFC6 }
        $tea_sum_calculated2 = { 8145F83F020000 }

    condition:
        uint16(0) == 0x5A4D and
        uint32(uint32(0x3C)) == 0x00004550 and
        $shellcode_size and $shellcode_addr and
        (1 of ($tea_const_*) or 2 of ($tea_sum_calculated*)) and
        math.entropy(0, filesize) > 6.5
}
This Yara rule can be improved by you to reduce the number of false positives or increase the match ratio. You can now hunt (search for new samples) on platforms such as VirusTotal (if you have a license), MalwareBazaar, UnpacMe, or in your own database using a tool such as mquery (open-source and developed by CERT.pl).
Extract shellcode (layer 2)
To extract the shellcode from the binary, we can use our disassembler API to automate decryption and extraction. We know the address of the shellcode, its size and the encryption algorithm.
from binaryninja import *
import sys
from ctypes import *

output_shellcode_path = "/tmp/shellcode"
encrypted_blob_shellcode_address = 0x41f0e8
encrypted_blob_shellcode_length = 0x37718
# Crypto key found in Tea function @0x0040146e
KEY = [0x1ed822c8, 0x1eda8d45, 0x6fd0bf39, 0x19ea64a5]

def tea_decipher(v):
    y = c_uint32(v[0])
    z = c_uint32(v[1])
    sum = c_uint32(0xc6ef3720)
    delta = 0x9e3779b9
    n = 32
    w = [0,0]
    while(n>0):
        z.value -= ( y.value << 4 ) + KEY[2] ^ y.value + sum.value ^ ( y.value >> 5 ) + KEY[3]
        y.value -= ( z.value << 4 ) + KEY[0] ^ z.value + sum.value ^ ( z.value >> 5 ) + KEY[1]
        sum.value -= delta
        n -= 1
    w[0] = y.value
    w[1] = z.value
    return w

def bytes_to_int32_array(byte_data):
    num_int32 = len(byte_data) // 4
    int32_array = struct.unpack("<{}I".format(num_int32), byte_data)
    return int32_array

def int32_array_to_bytes(int32_array):
    byte_data = struct.pack("<{}I".format(len(int32_array)), *int32_array)
    return byte_data

def main():
    encrypted_blob_shellcode = bv.read(encrypted_blob_shellcode_address, encrypted_blob_shellcode_length)
    encrypted_blob_shellcode_int32_array = bytes_to_int32_array(encrypted_blob_shellcode)
    i = 0
    decrypted_shellcode_int32_array = []
    while i < encrypted_blob_shellcode_length/4:
        memory_area = [
            encrypted_blob_shellcode_int32_array[i],
            encrypted_blob_shellcode_int32_array[i+1]
        ]
        memory_area = tea_decipher(memory_area)
        decrypted_shellcode_int32_array.append(memory_area[0])
        decrypted_shellcode_int32_array.append(memory_area[1])
        i+=2

    f = open(output_shellcode_path, "wb+")
    f.write(int32_array_to_bytes(decrypted_shellcode_int32_array))
    f.close()
    print(f"Stage2 dumped : {output_shellcode_path}")
    return

main()
Shellcode is then extracted, but this is not the originally packed program. This shellcode continues loading the various elements and calls up allocation and decryption methods. You can continue its analysis to go step by step through the decryption of the sample.
Shellcode analysis will not be covered in this article. We chose to take a more traditional approach to extraction, either using manual extraction or, to save time, automated extraction with an emulator.
Unpack the sample automatically with MIASM
When you encounter the same type of packer several times, or when you want to scale up your analyses, it may be a good idea to automate your actions.
You can use sandboxes to extract samples. The drawback is that some packer programs or malware use anti-VM techniques, and the execution (VM restoration and analysis time) can be more or less long and require a lot of machine resources. Using a sandbox can be complicated, especially if you have a very large number of samples to extract.
One possible solution (which also has its drawbacks) is to use an emulation solution. In this article, we chose the jitter of MIASM to emulate our sample. We chose MIASM because it meets our needs very well. But there are also emulators with a sandbox, such as Qiling.
Preparation of the environment
We will use the Jitter module of MIASM and its sandbox example here.
To run the basic script, you need to install the MIASM environment:
git clone https://github.com/cea-sec/miasm.git
python3 -m venv ./venv/
source venv/bin/activate
cd miasm
python3 setup.py install
You can display script help with the --help option:
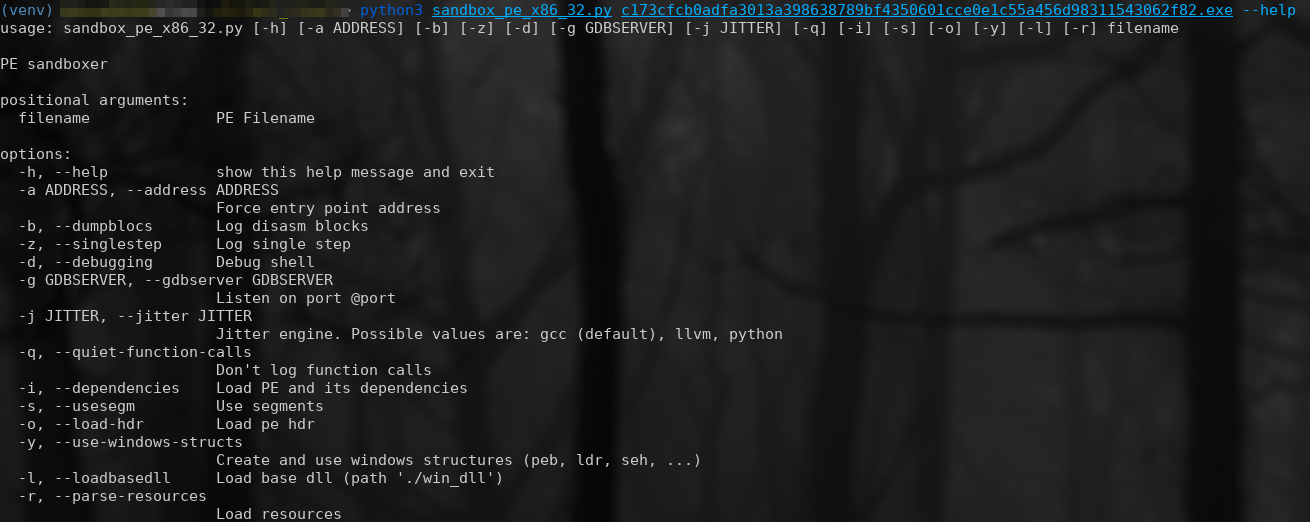
Throughout the development of the unpacker, you will be confronted with errors of various kinds, non-existent memory zones, WinAPI methods not implemented in MIASM, etc... Example:

New libraries
You should encounter a problem: the loading of new DLLs that are not present in your project by default. Below is the error this generates, where msimg32.dll is missing:
[INFO    ]: kernel32_LoadLibrary(dllname=0x4192f8) ret addr: 0x401871
[WARNING ]: Create dummy entry for 'msimg32.dll'
WARNING: address 0x341EDC is not mapped in virtual memory:
Traceback (most recent call last):
  File "/home/user/Dev/test_stealc/sandbox_pe_x86_32.py", line 143, in <module>
    sb.run()
  File "/home/user/Dev/test_stealc/venv/lib/python3.11/site-packages/miasm-0.1.5.dev47-py3.11-linux-x86_64.egg/miasm/analysis/sandbox.py", line 529, in run
    super(Sandbox_Win_x86_32, self).run(addr)
  File "/home/user/Dev/test_stealc/venv/lib/python3.11/site-packages/miasm-0.1.5.dev47-py3.11-linux-x86_64.egg/miasm/analysis/sandbox.py", line 136, in run
    self.jitter.continue_run()
  File "/home/user/Dev/test_stealc/venv/lib/python3.11/site-packages/miasm-0.1.5.dev47-py3.11-linux-x86_64.egg/miasm/jitter/jitload.py", line 430, in continue_run
    return next(self.run_iterator)
           ^^^^^^^^^^^^^^^^^^^^^^^
  File "/home/user/Dev/test_stealc/venv/lib/python3.11/site-packages/miasm-0.1.5.dev47-py3.11-linux-x86_64.egg/miasm/jitter/jitload.py", line 395, in runiter_once
    raise JitterException(exception_flag)
miasm.jitter.jitload.JitterException: A jitter exception occurred: DO_NOT_UPDATE_PC & ACCESS_VIOL (0x2004000)
You can create a win_dll folder, which must contain standard Windows libraries (DLL). Add missing DLLs you may find on a healthy Windows system. Once you've added the directory, you should be able to continue running your program.
MIASM and Windows API
By default, the sandbox does not use system environment options, such as memory segments, Windows structures, etc... You can add them by specifying them as arguments to the -o -i -s -y script. As you can see from the execution below, we take this a step further by crashing a Windows function (FlsAlloc from the kernel32.dll library):
$ python3 sandbox_pe_x86_32.py -o -i -s -y c173cfcb0adfa3013a398638789bf4350601cce0e1c55a456d98311543062f82.exe
cannot find crypto, skipping
[ERROR   ]: Cannot open win_dll/kernel32.dll
[ERROR   ]: Cannot open win_dll/gdi32.dll
c173cfcb0adfa3013a398638789bf4350601cce0e1c55a456d98311543062f82.exe
kernel32.dll
gdi32.dll
[WARNING ]: Create dummy entry for 'kernel32.dll'
[WARNING ]: Create dummy entry for 'gdi32.dll'
[INFO    ]: Add module 400000 'c173cfcb0adfa3013a398638789bf4350601cce0e1c55a456d98311543062f82.exe'
[WARNING ]: Unknown module: omitted from link list ('kernel32.dll')
[WARNING ]: Unknown module: omitted from link list ('gdi32.dll')
[WARNING ]: No main pe, ldr data will be unconsistant [<miasm.loader.pe_init.PE object at 0x7f7020a680d0>, None, None]
[WARNING ]: No main pe, ldr data will be unconsistant
[WARNING ]: No main pe, ldr data will be unconsistant
[INFO    ]: kernel32_GetSystemTimeAsFileTime(lpSystemTimeAsFileTime=0x13ffdc) ret addr: 0x409c40
[INFO    ]: kernel32_GetCurrentThreadId() ret addr: 0x409c4f
[INFO    ]: kernel32_GetCurrentProcessId() ret addr: 0x409c58
[INFO    ]: kernel32_QueryPerformanceCounter(lpPerformanceCount=0x13ffd4) ret addr: 0x409c65
[INFO    ]: kernel32_GetStartupInfo(ptr=0x13ff6c) ret addr: 0x405194
[INFO    ]: kernel32_GetProcessHeap() ret addr: 0x406d4e
[INFO    ]: kernel32_EncodePointer(0x0) ret addr: 0x403ff1
[INFO    ]: kernel32_EncodePointer(0x403b32) ret addr: 0x403b84
[INFO    ]: kernel32_GetModuleHandle(dllname=0x413ab8) ret addr: 0x405222
[INFO    ]: kernel32_GetProcAddress(libbase=0x71112000, fname=0x413ad4) ret addr: 0x405232
[INFO    ]: kernel32_GetProcAddress(libbase=0x71112000, fname=0x413ae0) ret addr: 0x405245
[INFO    ]: kernel32_GetProcAddress(libbase=0x71112000, fname=0x413ae8) ret addr: 0x405258
[INFO    ]: kernel32_GetProcAddress(libbase=0x71112000, fname=0x413af4) ret addr: 0x40526b
[INFO    ]: kernel32_GetProcAddress(libbase=0x71112000, fname=0x413b00) ret addr: 0x40527e
[INFO    ]: kernel32_GetProcAddress(libbase=0x71112000, fname=0x413b1c) ret addr: 0x405291
[INFO    ]: kernel32_GetProcAddress(libbase=0x71112000, fname=0x413b2c) ret addr: 0x4052a4
[INFO    ]: kernel32_GetProcAddress(libbase=0x71112000, fname=0x413b40) ret addr: 0x4052b7
[INFO    ]: kernel32_GetProcAddress(libbase=0x71112000, fname=0x413b58) ret addr: 0x4052ca
[INFO    ]: kernel32_GetProcAddress(libbase=0x71112000, fname=0x413b70) ret addr: 0x4052dd
[INFO    ]: kernel32_GetProcAddress(libbase=0x71112000, fname=0x413b84) ret addr: 0x4052f0
[INFO    ]: kernel32_GetProcAddress(libbase=0x71112000, fname=0x413ba4) ret addr: 0x405303
[INFO    ]: kernel32_GetProcAddress(libbase=0x71112000, fname=0x413bbc) ret addr: 0x405316
[INFO    ]: kernel32_GetProcAddress(libbase=0x71112000, fname=0x413bd4) ret addr: 0x405329
[INFO    ]: kernel32_GetProcAddress(libbase=0x71112000, fname=0x413be8) ret addr: 0x40533c
[INFO    ]: kernel32_GetProcAddress(libbase=0x71112000, fname=0x413bfc) ret addr: 0x40534f
[INFO    ]: kernel32_GetProcAddress(libbase=0x71112000, fname=0x413c18) ret addr: 0x405362
[INFO    ]: kernel32_GetProcAddress(libbase=0x71112000, fname=0x413c38) ret addr: 0x405375
[INFO    ]: kernel32_GetProcAddress(libbase=0x71112000, fname=0x413c54) ret addr: 0x405388
[INFO    ]: kernel32_GetProcAddress(libbase=0x71112000, fname=0x413c74) ret addr: 0x40539b
[INFO    ]: kernel32_GetProcAddress(libbase=0x71112000, fname=0x413c88) ret addr: 0x4053ae
[INFO    ]: kernel32_GetProcAddress(libbase=0x71112000, fname=0x413ca4) ret addr: 0x4053c1
[INFO    ]: kernel32_GetProcAddress(libbase=0x71112000, fname=0x413cb8) ret addr: 0x4053d4
[INFO    ]: kernel32_GetProcAddress(libbase=0x71112000, fname=0x413cc8) ret addr: 0x4053e7
[INFO    ]: kernel32_GetProcAddress(libbase=0x71112000, fname=0x413cd8) ret addr: 0x4053fa
[INFO    ]: kernel32_GetProcAddress(libbase=0x71112000, fname=0x413ce8) ret addr: 0x40540d
[INFO    ]: kernel32_GetProcAddress(libbase=0x71112000, fname=0x413cf8) ret addr: 0x405420
[INFO    ]: kernel32_GetProcAddress(libbase=0x71112000, fname=0x413d14) ret addr: 0x405433
[INFO    ]: kernel32_GetProcAddress(libbase=0x71112000, fname=0x413d28) ret addr: 0x405446
[INFO    ]: kernel32_GetProcAddress(libbase=0x71112000, fname=0x413d38) ret addr: 0x405459
[INFO    ]: kernel32_GetProcAddress(libbase=0x71112000, fname=0x413d4c) ret addr: 0x40546c
[INFO    ]: kernel32_GetProcAddress(libbase=0x71112000, fname=0x413d5c) ret addr: 0x40547f
[INFO    ]: kernel32_GetProcAddress(libbase=0x71112000, fname=0x413d7c) ret addr: 0x405492
[INFO    ]: kernel32_InitializeCriticalSectionEx(lpCriticalSection=0x457b90, dwSpinCount=0xfa0, Flags=0x0) ret addr: 0x4051c2
[INFO    ]: kernel32_InitializeCriticalSectionEx(lpCriticalSection=0x457ba8, dwSpinCount=0xfa0, Flags=0x0) ret addr: 0x4051c2
[INFO    ]: kernel32_InitializeCriticalSectionEx(lpCriticalSection=0x457bc0, dwSpinCount=0xfa0, Flags=0x0) ret addr: 0x4051c2
[INFO    ]: kernel32_InitializeCriticalSectionEx(lpCriticalSection=0x457bd8, dwSpinCount=0xfa0, Flags=0x0) ret addr: 0x4051c2
[INFO    ]: kernel32_InitializeCriticalSectionEx(lpCriticalSection=0x457bf0, dwSpinCount=0xfa0, Flags=0x0) ret addr: 0x4051c2
[INFO    ]: kernel32_InitializeCriticalSectionEx(lpCriticalSection=0x457c08, dwSpinCount=0xfa0, Flags=0x0) ret addr: 0x4051c2
[INFO    ]: kernel32_InitializeCriticalSectionEx(lpCriticalSection=0x457c20, dwSpinCount=0xfa0, Flags=0x0) ret addr: 0x4051c2
[INFO    ]: kernel32_InitializeCriticalSectionEx(lpCriticalSection=0x457c38, dwSpinCount=0xfa0, Flags=0x0) ret addr: 0x4051c2
[INFO    ]: kernel32_InitializeCriticalSectionEx(lpCriticalSection=0x457c50, dwSpinCount=0xfa0, Flags=0x0) ret addr: 0x4051c2
[INFO    ]: kernel32_InitializeCriticalSectionEx(lpCriticalSection=0x457c68, dwSpinCount=0xfa0, Flags=0x0) ret addr: 0x4051c2
[INFO    ]: kernel32_InitializeCriticalSectionEx(lpCriticalSection=0x457c80, dwSpinCount=0xfa0, Flags=0x0) ret addr: 0x4051c2
[INFO    ]: kernel32_InitializeCriticalSectionEx(lpCriticalSection=0x457c98, dwSpinCount=0xfa0, Flags=0x0) ret addr: 0x4051c2
[INFO    ]: kernel32_InitializeCriticalSectionEx(lpCriticalSection=0x457cb0, dwSpinCount=0xfa0, Flags=0x0) ret addr: 0x4051c2
[INFO    ]: kernel32_InitializeCriticalSectionEx(lpCriticalSection=0x457cc8, dwSpinCount=0xfa0, Flags=0x0) ret addr: 0x4051c2
Traceback (most recent call last):
  File "/home/user/Dev/test_stealc/sandbox_pe_x86_32.py", line 16, in <module>
    sb.run()
  File "/home/user/Dev/test_stealc/venv/lib/python3.11/site-packages/miasm-0.1.5.dev47-py3.11-linux-x86_64.egg/miasm/analysis/sandbox.py", line 529, in run
    super(Sandbox_Win_x86_32, self).run(addr)
  File "/home/user/Dev/test_stealc/venv/lib/python3.11/site-packages/miasm-0.1.5.dev47-py3.11-linux-x86_64.egg/miasm/analysis/sandbox.py", line 136, in run
    self.jitter.continue_run()
  File "/home/user/Dev/test_stealc/venv/lib/python3.11/site-packages/miasm-0.1.5.dev47-py3.11-linux-x86_64.egg/miasm/jitter/jitload.py", line 430, in continue_run
    return next(self.run_iterator)
           ^^^^^^^^^^^^^^^^^^^^^^^
  File "/home/user/Dev/test_stealc/venv/lib/python3.11/site-packages/miasm-0.1.5.dev47-py3.11-linux-x86_64.egg/miasm/jitter/jitload.py", line 369, in runiter_once
    for res in self.breakpoints_handler.call_callbacks(self.pc, self):
  File "/home/user/Dev/test_stealc/venv/lib/python3.11/site-packages/miasm-0.1.5.dev47-py3.11-linux-x86_64.egg/miasm/jitter/jitload.py", line 129, in call_callbacks
    res = c(*args)
          ^^^^^^^^
  File "/home/user/Dev/test_stealc/venv/lib/python3.11/site-packages/miasm-0.1.5.dev47-py3.11-linux-x86_64.egg/miasm/jitter/jitload.py", line 517, in handle_lib
    raise ValueError('unknown api', hex(jitter.pc), repr(fname))
ValueError: ('unknown api', '0x71112624', "'kernel32_FlsAlloc'")
If you don't want to specify the above-mentioned script options, you can force them into your script:
options = parser.parse_args()
options.usesegm = True
options.use_windows_structs = True
options.load_hdr = True
options.dependencies = True
The FLS methods have been implemented in MIASM, we will use them in our script:
from miasm.os_dep.win_api_x86_32 import FLS
[...]
fls = FLS()
kernel32_FlsAlloc = fls.kernel32_FlsAlloc
kernel32_FlsSetValue = fls.kernel32_FlsSetValue
kernel32_FlsGetValue = fls.kernel32_FlsGetValue
Functions not implemented
Adding these lines allows us to go further in executing the program, until a similar error appears, indicating that the GetEnvironmentStringsW method in kernel32.dll is not implemented:
ValueError: ('unknown api', '0x71112564', "'kernel32_GetEnvironmentStringsW'")
Not all methods are implemented in MIASM, and sometimes you'll have to write them yourself in order to achieve your goal in program execution.
One of MIASM's contributors (Commial) published on his GitHub a list of WinAPI methods with input parameters from several libraries. You can use this as a basis for implementing methods that are not present in MIASM.
In some cases, you don't necessarily have to simulate the actual behavior of a method. Some malware only checks the return value of the function, so you can force the value to avoid triggering an error or being directed to an unwanted branch.
According to MSDN, the GetEnvironmentStringsW method takes no arguments and returns a pointer to a string of Wild characters. We can implement the method as follows:
from miasm.jitter.csts import *
from miasm.os_dep.common import set_win_str_w
from miasm.os_dep.win_api_x86_32 import FLS, winobjs
[...]
GetEnvironmentStringsW_addr = None

def kernel32_GetEnvironmentStringsW(jitter):
  """
  LPWCH GetEnvironmentStringsW()
  """
  global GetEnvironmentStringsW_addr
  # Get return address and function arguments
  ret_ad, args = jitter.func_args_stdcall([])

  # If GetEnvironmentStrings isn't allocated yet
  if not GetEnvironmentStringsW_addr:
    # Get next allocation address on heap
    alloc_addr = winobjs.heap.next_addr(50)
    # Allocate memory on heap
    winobjs.allocated_pages[alloc_addr] = (alloc_addr, 50)
    # Allocate memory page with READ/WRITE permission and write 50 bytes of nullbytes
    jitter.vm.add_memory_page(alloc_addr, PAGE_READ | PAGE_WRITE, b"\x00"*50)
    # Put env variable in allocated memory
    set_win_str_w(jitter, alloc_addr, "HelloWorld")
    # Store allocated address for next call of GetEnviromentStringsW
    GetEnvironmentStringsW_addr = alloc_addr
    # Return address of allocated memory
  jitter.func_ret_stdcall(ret_ad, GetEnvironmentStringsW_addr)
[...]
The next execution causes problems for the FreeEnvironmentStringsW method. As mentioned earlier, you can return a value expected by the program without having to actually implement the method:
def kernel32_FreeEnvironmentStringsW(jitter):
    ret_ad, args = jitter.func_args_stdcall(["lpszEnvironmentBlock"])
    jitter.func_ret_stdcall(ret_ad, 1)
    jitter.running = True
    return True
Continue implementing the various methods on your own, as the logic remains very similar.
Anti-emulation
At some point, you'll come to a repetitive call to the GetCurrentProcess and GetCurrentProcessId methods:
[...]
[INFO    ]: kernel32_GetCurrentProcessId() ret addr: 0x401b70
[INFO    ]: kernel32_GetCurrentProcess() ret addr: 0x401b76
[INFO    ]: kernel32_GetCurrentProcessId() ret addr: 0x401b70
[INFO    ]: kernel32_GetCurrentProcess() ret addr: 0x401b76
[... SAME LINES ...]
[INFO    ]: kernel32_GetCurrentProcessId() ret addr: 0x401b70
[INFO    ]: kernel32_GetCurrentProcess() ret addr: 0x401b76
[INFO    ]: kernel32_GetCurrentProcessId() ret addr: 0x401b70
[INFO    ]: kernel32_GetCurrentProcess() ret addr: 0x401b76
[... SAME LINES ...]
[INFO    ]: kernel32_GetCurrentProcessId() ret addr: 0x401b70
[INFO    ]: kernel32_GetCurrentProcess() ret addr: 0x401b76
[INFO    ]: kernel32_GetCurrentProcessId() ret addr: 0x401b70
[INFO    ]: kernel32_GetCurrentProcess() ret addr: 0x401b76
[INFO    ]: kernel32_GetCurrentProcessId() ret addr: 0x401b70
[INFO    ]: kernel32_GetCurrentProcess() ret addr: 0x401b76
[INFO    ]: kernel32_GetCurrentProcessId() ret addr: 0x401b70
^C
KeyboardInterrupt
The return addresses for these methods are 0x401b70 and 0x401b76. Open the program in your disassembler and go to these addresses. You should find the following code:
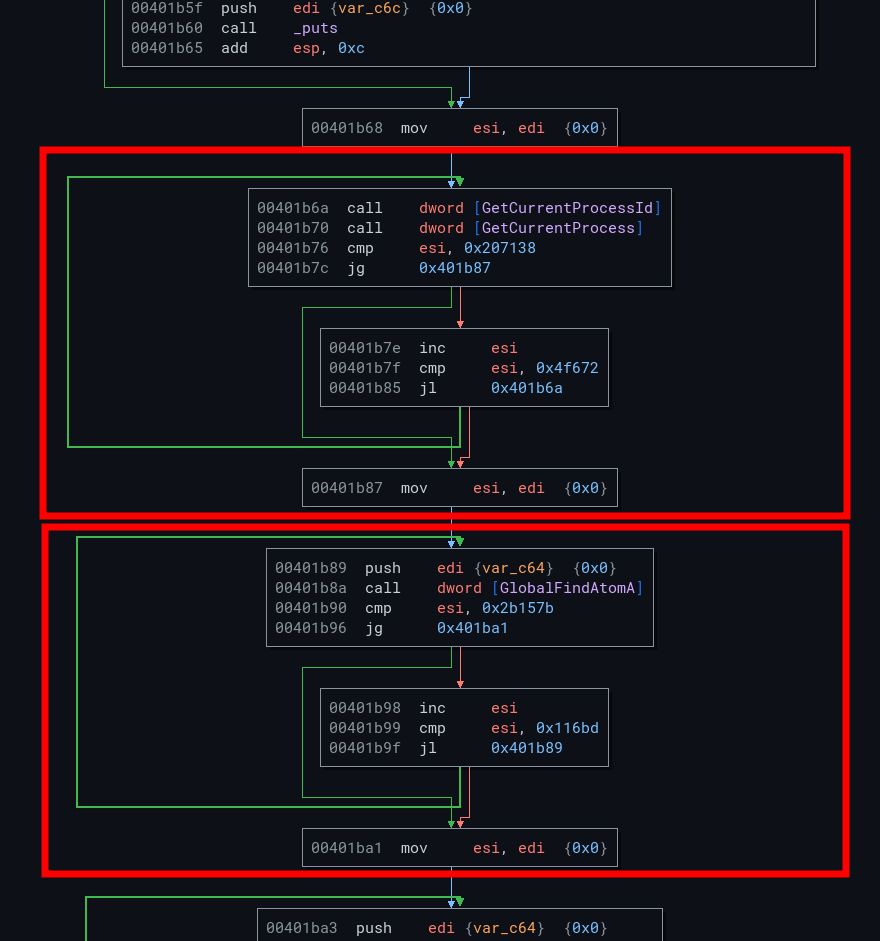
As you can see, you've just encountered the loop in the first red frame. The GetCurrentProcessId and GetCurrentProcess methods are called a very large number of times (without the return values of these functions being checked) as long as the value of the ESI register is less than 0x4f672.
This is an anti-emulation method. On a real environment, the execution of this loop is very fast, but when the environment is emulated, execution is much longer. Some security systems, such as antivirus software, stop their analysis when they encounter this type of situation.
You have several options:
- Wait until the end (beware, a second loop will follow)
- Bypass this loop by adding a breakpoint in MIASM
- Implement an anti-anti-emulation bypass code
First, we'll opt for the second method: bypass this loop in the hope that the packer doesn't evolve too much over time and that the anti-emulation mechanisms are fixed (spoiler: the packer evolves, constants, WinAPI methods, loops required for unpacking or not...).
def jmp_0x00401bda(jitter):
    jitter.pc = 0x00401bda
    jitter.running = True
    return True
[...]
sb.jitter.add_breakpoint(0x401b68, jmp_0x00401bda) # anti-emu GetCurrentProcess & GetCurrentProcessId
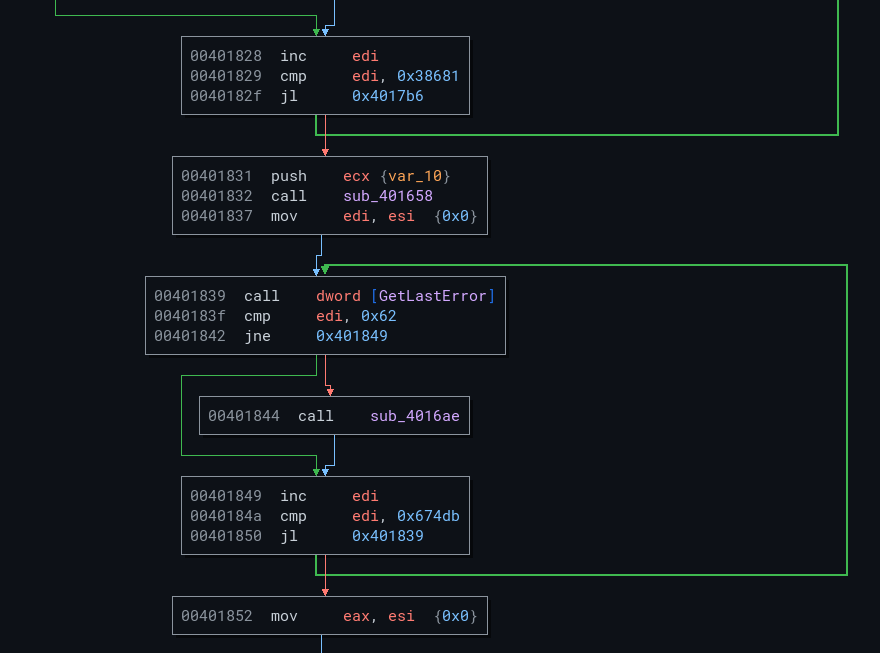
Continue execution and you'll encounter anti-emulation again. Here, the GetLastError method is called without checking its return:
[...]
def set_esi_0x674db(jitter):
    jitter.cpu.ESI = 0x674db
    jitter.running = True
    return True
[...]
sb.jitter.add_breakpoint(0x401829, set_esi_0x674db) # anti-emu GetLastError
sb.jitter.add_breakpoint(0x40184a, set_esi_0x674db) # anti-emu GetLastError
SEH
The next step you should encounter after implementing the non-existent Module32First method in MIASM is access to a non-existent memory area (0x7FFFF000):
[INFO    ]: kernel32_CreateToolhelp32Snapshot(dwflags=0x8, th32processid=0x0) ret addr: 0x2000f7d1
[INFO    ]: kernel32_Module32First(hSnapshot=0xaaaa00, lpme=0x13d49c) ret addr: 0x2000f7f1
[INFO    ]: kernel32_VirtualAlloc(lpvoid=0x0, dwsize=0x6bc67, alloc_type=0x1000, flprotect=0x40) ret addr: 0x2000f4b9
[INFO    ]: kernel32_GetProcAddress(libbase=0x7c800000, fname=0x13c438) ret addr: 0x20047a22
WARNING: address 0x7FFFF000 is not mapped in virtual memory:
Traceback (most recent call last):
  File "/home/user/Dev/test_stealc/sandbox_pe_x86_32.py", line 151, in <module>
    sb.run()
  File "/home/user/Dev/test_stealc/venv/lib/python3.11/site-packages/miasm-0.1.5.dev47-py3.11-linux-x86_64.egg/miasm/analysis/sandbox.py", line 529, in run
    super(Sandbox_Win_x86_32, self).run(addr)
  File "/home/user/Dev/test_stealc/venv/lib/python3.11/site-packages/miasm-0.1.5.dev47-py3.11-linux-x86_64.egg/miasm/analysis/sandbox.py", line 136, in run
    self.jitter.continue_run()
  File "/home/user/Dev/test_stealc/venv/lib/python3.11/site-packages/miasm-0.1.5.dev47-py3.11-linux-x86_64.egg/miasm/jitter/jitload.py", line 430, in continue_run
    return next(self.run_iterator)
           ^^^^^^^^^^^^^^^^^^^^^^^
  File "/home/user/Dev/test_stealc/venv/lib/python3.11/site-packages/miasm-0.1.5.dev47-py3.11-linux-x86_64.egg/miasm/jitter/jitload.py", line 395, in runiter_once
    raise JitterException(exception_flag)
miasm.jitter.jitload.JitterException: A jitter exception occurred: DO_NOT_UPDATE_PC & ACCESS_VIOL (0x2004000)
To understand in more detail what's happening at this point, you can display the new instruction blocks in MIASM using the -b option. You can also debug instruction by instruction using the -z option. You can trigger these verbosity modes directly from your code with the following snippet:
jitter.set_trace_log(
    trace_instr=False, # Display each instructions
    trace_regs=False, # Display registers values
    trace_new_blocks=True # Display new instructions block
)
This produces the following code:
loc_2004704c
CALL       loc_20047a3f
->    c_next:loc_20047051
loc_20047a3f
PUSH       EBP
MOV        EBP, ESP
PUSH       ECX
MOV        EAX, DWORD PTR FS:[0x0] ; Get TIB ptr
MOV        DWORD PTR [EBP + 0xFFFFFFFC], EAX ; Store TIB ptr in [EBP-0x4]
MOV        EAX, DWORD PTR [EBP + 0xFFFFFFFC] ; Get TIB TIB which was stored in stack
JMP        loc_20047a56
->    c_to:loc_20047a56
loc_20047a56
CMP        DWORD PTR [EAX], 0xFFFFFFFF ; compare deref TIB ptr with 0xFFFFFFFF
JNZ        loc_20047a51
->    c_next:loc_20047a5b     c_to:loc_20047a51
loc_20047a51
MOV        EAX, DWORD PTR [EAX]
MOV        DWORD PTR [EBP + 0xFFFFFFFC], EAX
CMP        DWORD PTR [EAX], 0xFFFFFFFF
JNZ        loc_20047a51
->    c_next:loc_20047a5b     c_to:loc_20047a51
As you can see, the packer code retrieves the TIB (Thread Information Block) pointer and compares its contents. The address contained in FS:[0x0] is 0x7FFFF000. We can allocate memory at this address and write 0xFFFFFFFF to it to validate the comparison:
sb.jitter.vm.add_memory_page(0x7FFFF000, PAGE_READ | PAGE_WRITE, b"\xff"*4) # SEH
PE extraction
You should then arrive at the phase where the program exits with the atexit method of msvcr100.dll. Don't bother implementing it, as what we're interested in happens before that. As seen in the manual unpacking phase, we have two VirtualAlloc and one VirtualFree:
[INFO    ]: kernel32_Module32First(hSnapshot=0xaaaa00, lpme=0x13d49c) ret addr: 0x2000f7f1
[INFO    ]: kernel32_VirtualAlloc(lpvoid=0x0, dwsize=0x6bc67, alloc_type=0x1000, flprotect=0x40) ret addr: 0x2000f4b9
[INFO    ]: kernel32_GetProcAddress(libbase=0x7c800000, fname=0x13c438) ret addr: 0x20047a22
[INFO    ]: kernel32_LoadLibrary(dllname=0x13d3e4) ret addr: 0x20047099
[INFO    ]: kernel32_GetProcAddress(libbase=0x7c800000, fname=0x13d3e4) ret addr: 0x200470ce
[INFO    ]: kernel32_GetProcAddress(libbase=0x7c800000, fname=0x13d3e4) ret addr: 0x20047106
[INFO    ]: kernel32_GetProcAddress(libbase=0x7c800000, fname=0x13d3e4) ret addr: 0x20047134
[INFO    ]: kernel32_GetProcAddress(libbase=0x7c800000, fname=0x13d3e4) ret addr: 0x2004716c
[INFO    ]: kernel32_GetProcAddress(libbase=0x7c800000, fname=0x13d3e4) ret addr: 0x200471a8
[INFO    ]: kernel32_GetProcAddress(libbase=0x7c800000, fname=0x13d3e4) ret addr: 0x200471e0
[INFO    ]: kernel32_GetProcAddress(libbase=0x7c800000, fname=0x13d3e4) ret addr: 0x20047215
[INFO    ]: kernel32_SetErrorMode(uMode=0x400) ret addr: 0x20047e1c
[INFO    ]: kernel32_SetErrorMode(uMode=0x0) ret addr: 0x20047e21
[INFO    ]: kernel32_GetVersionEx(ptr_struct=0x13c3cc) ret addr: 0x20047dad
[INFO    ]: kernel32_VirtualAlloc(lpvoid=0x0, dwsize=0x6ae00, alloc_type=0x1000, flprotect=0x4) ret addr: 0x20047250
[INFO    ]: kernel32_VirtualProtect(lpvoid=0x400000, dwsize=0x6e000, flnewprotect=0x40, lpfloldprotect=0x13d454) ret addr: 0x200472e6
[WARNING ]: set page 400000 7
[WARNING ]: set page 401000 7
[WARNING ]: set page 412000 7
[WARNING ]: create page 41b000 7
[WARNING ]: create page 46e000 7
[INFO    ]: kernel32_VirtualFree(lpvoid=0x200b3000, dwsize=0x0, alloc_type=0x8000) ret addr: 0x20047446
[INFO    ]: kernel32_LoadLibrary(dllname=0x43851c) ret addr: 0x200474f6
[...]
[INFO    ]: kernel32_LoadLibrary(dllname=0x13d3e4) ret addr: 0x2004789d
[WARNING ]: Create dummy entry for 'msvcr100.dll'
[INFO    ]: kernel32_GetProcAddress(libbase=0x7111a000, fname=0x13d3e4) ret addr: 0x200478c7
Traceback (most recent call last):
  File "/home/user/Dev/test_stealc/sandbox_pe_x86_32.py", line 168, in <module>
    sb.run()
  File "/home/user/Dev/test_stealc/venv/lib/python3.11/site-packages/miasm-0.1.5.dev47-py3.11-linux-x86_64.egg/miasm/analysis/sandbox.py", line 529, in run
    super(Sandbox_Win_x86_32, self).run(addr)
  File "/home/user/Dev/test_stealc/venv/lib/python3.11/site-packages/miasm-0.1.5.dev47-py3.11-linux-x86_64.egg/miasm/analysis/sandbox.py", line 136, in run
    self.jitter.continue_run()
  File "/home/user/Dev/test_stealc/venv/lib/python3.11/site-packages/miasm-0.1.5.dev47-py3.11-linux-x86_64.egg/miasm/jitter/jitload.py", line 430, in continue_run
    return next(self.run_iterator)
           ^^^^^^^^^^^^^^^^^^^^^^^
  File "/home/user/Dev/test_stealc/venv/lib/python3.11/site-packages/miasm-0.1.5.dev47-py3.11-linux-x86_64.egg/miasm/jitter/jitload.py", line 369, in runiter_once
    for res in self.breakpoints_handler.call_callbacks(self.pc, self):
  File "/home/user/Dev/test_stealc/venv/lib/python3.11/site-packages/miasm-0.1.5.dev47-py3.11-linux-x86_64.egg/miasm/jitter/jitload.py", line 129, in call_callbacks
    res = c(*args)
          ^^^^^^^^
  File "/home/user/Dev/test_stealc/venv/lib/python3.11/site-packages/miasm-0.1.5.dev47-py3.11-linux-x86_64.egg/miasm/jitter/jitload.py", line 517, in handle_lib
    raise ValueError('unknown api', hex(jitter.pc), repr(fname))
ValueError: ('unknown api', '0x7111a004', "'msvcr100_atexit'")
We'll modify MIASM's VirtualFree method and register the memory zone starting with MZ like this:
import os
[...]
def kernel32_VirtualFree(jitter):
    ret_ad, args = jitter.func_args_stdcall(["lpvoid", "dwsize", "alloc_type"])
    all_mem = jitter.vm.get_all_memory()
    for region in all_mem:
        if region != args.lpvoid:
            continue
        region_data = all_mem[region]["data"]
        if region_data[:2] == b"MZ":
            print(f"PE unpacked : '{out_fname}' (Region : 0x{region:x})")
            f = open(out_fname, "wb")
            f.write(region_data)
            f.close()
            exit()
[...]
bname, fname = os.path.split(options.filename)
fname = os.path.join(bname, fname.replace('.', '_'))
out_fname = fname + '_miasm_unpacked.bin'
This generates the following result after execution:
[...]
[INFO    ]: kernel32_VirtualFree(lpvoid=0x200b3000, dwsize=0x0, alloc_type=0x8000) ret addr: 0x20047446
PE unpacked : 'c173cfcb0adfa3013a398638789bf4350601cce0e1c55a456d98311543062f82_exe_miasm_unpacked.bin' (Region : 0x200b3000)
You can compare the cryptographic fingerprint of the manually unpacked PE with the one you've just generated with MIASM:
$ sha256sum c173cfcb0adfa3013a398638789bf4350601cce0e1c55a456d98311543062f82_exe_miasm_unpacked.bin
9874c7bd9d008c8a7105c8e402813204d5c3ddc3fb8d1aaddbb0e19d65062dfb
Congratulations! You've just unpacked Stage 1 with MIASM! \o/
You'll find the complete code for extraction with MIASM here.
You can go on to the next article to analyze this unpacked sample Loader analysis (Stage 2).
